TRX Tron / US Dollar - What the price action is saying! (35% reward of this post will go to Project Hope)
Just 2 days ago I shared my analysis on this token on a long term view. I have come across this token recently and since I liked its price action and overall chart very much, I thought why not analyze it on a shorter time frame as well and after doing all that, today itself it has been added to my favorite tokens and I hope to make some purchases in it soon. Not because it has recently seen an up move of more than 100% and I am feeling FOMO right now, but because this project is so amazing, so investing in it is worth it and at the same time its price action is also looking so beautiful that you can also make money by trading in it that too with a basic understanding of technical analysis. But there is no point in making things by drawing trendlines on old historical charts, so let's talk about its current price action and try to know what can happen next.
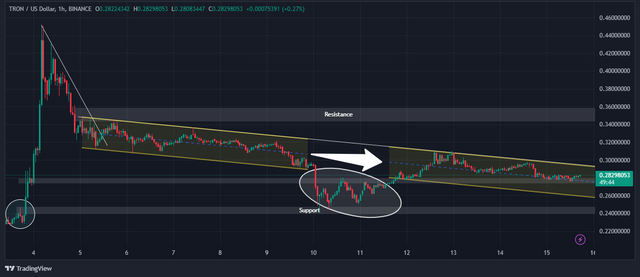
Look at the price action inside the small circle on the left side of the chart, this is the place from where the upmove of more than 100% in the first week of December started and then the buying that happened after that is in front of you all. After that, we also saw a pullback of 50 to 60 percent in the prices which is also normal after such a price hike because people also do profit booking. The problem starts after that because that profit booking pullback gets extended and the price comes down further in a proper downtrend.
By the way, this is a chart with a time frame of 1 hour. Well, now in the middle of the chart, you can see 2 downtrend ranges in yellow colour. These are the same trend in which the trend broke downwards once in the middle but after buying from key support, it again started trading somewhat in the same range.
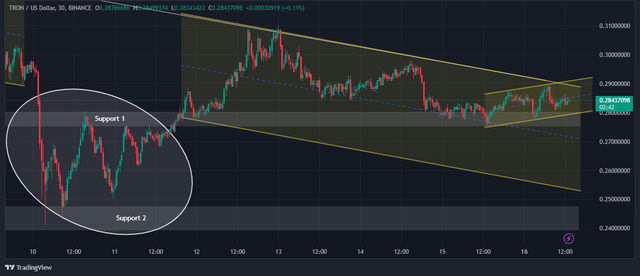
If we look at a smaller time frame, we see another support between the main support and resistance where the price spent most of its time after the fake breakout of the downward direction. Here you can currently see another small uptrend which can be analyzed on a 15 or 5 minute timeframe and traded for a move of 4 to 5 per cent but only with strict SL orders, otherwise a big candle against you will wipe out a large part of your capital in no time.
Since the price is currently in a small downtrend with low volatility, it would be foolish to plan a trade for a good directional move until the price is sustained outside the main support and resistance or the current sloping downtrend.
35% of the rewards of this post will go to Project Hope (@ph-fund).


The price of TRX will definitely go further up I am sure in the next few years. This is the best time to invest