Bitcoin Slides Below $74K — Market Pullback or Setup for a Deeper Drop?

Market Overview
Bitcoin declined 1.85% over the past 24 hours, trading near $73,771, closely tracking a ~1.38% drop in total crypto market capitalization (now around $2.52T).
Notably, Bitcoin is showing very weak correlation with traditional markets:
S&P 500 correlation: ~0.10
Gold correlation: ~0.12
This indicates the move is crypto-native, driven by internal market structure rather than macroeconomic catalysts such as equities or commodities.
- Broad Crypto Market Pullback
Bitcoin’s decline aligns almost perfectly with the broader digital asset market, confirming a sector-wide risk-off move.
Key Observations
Total crypto market cap fell ~1.38%
No major macro or regulatory catalyst identified
Selling pressure appears systematic rather than event-driven
Interpretation
This type of synchronized decline typically reflects:
Profit-taking after recent upside
Short-term liquidity rotation
A temporary shift to risk-off positioning within crypto
What to Watch
A recovery in total market cap above $2.56T would signal renewed bullish participation
- Technical Rejection and Derivatives Unwinding
From a structural standpoint, Bitcoin is showing clear signs of short-term weakness.
Technical Breakdown
Rejected at 50% Fibonacci retracement (~$74,716)
Trading below 7-day SMA (~$74,463)
Momentum shifting from bullish → neutral/bearish
Derivatives Data
Total liquidations: ~$120.44M (majority long positions)
Funding rate: Slightly negative (~ -0.0014%)
This confirms long-side pressure, where bullish traders are being forced out of positions.
Momentum Indicator
RSI (14): ~46.5
Below equilibrium (50)
Not yet oversold (<30)
Interpretation
The move is not panic-driven, but rather a controlled unwind of leverage
Negative funding suggests shorts are gaining confidence
Key Signal to Monitor
RSI approaching oversold territory (<30) could indicate:
Seller exhaustion
Potential relief bounce
- Key Levels and Price Structure
Based on current price action and your chart structure, Bitcoin is testing a critical support zone.
Important Levels
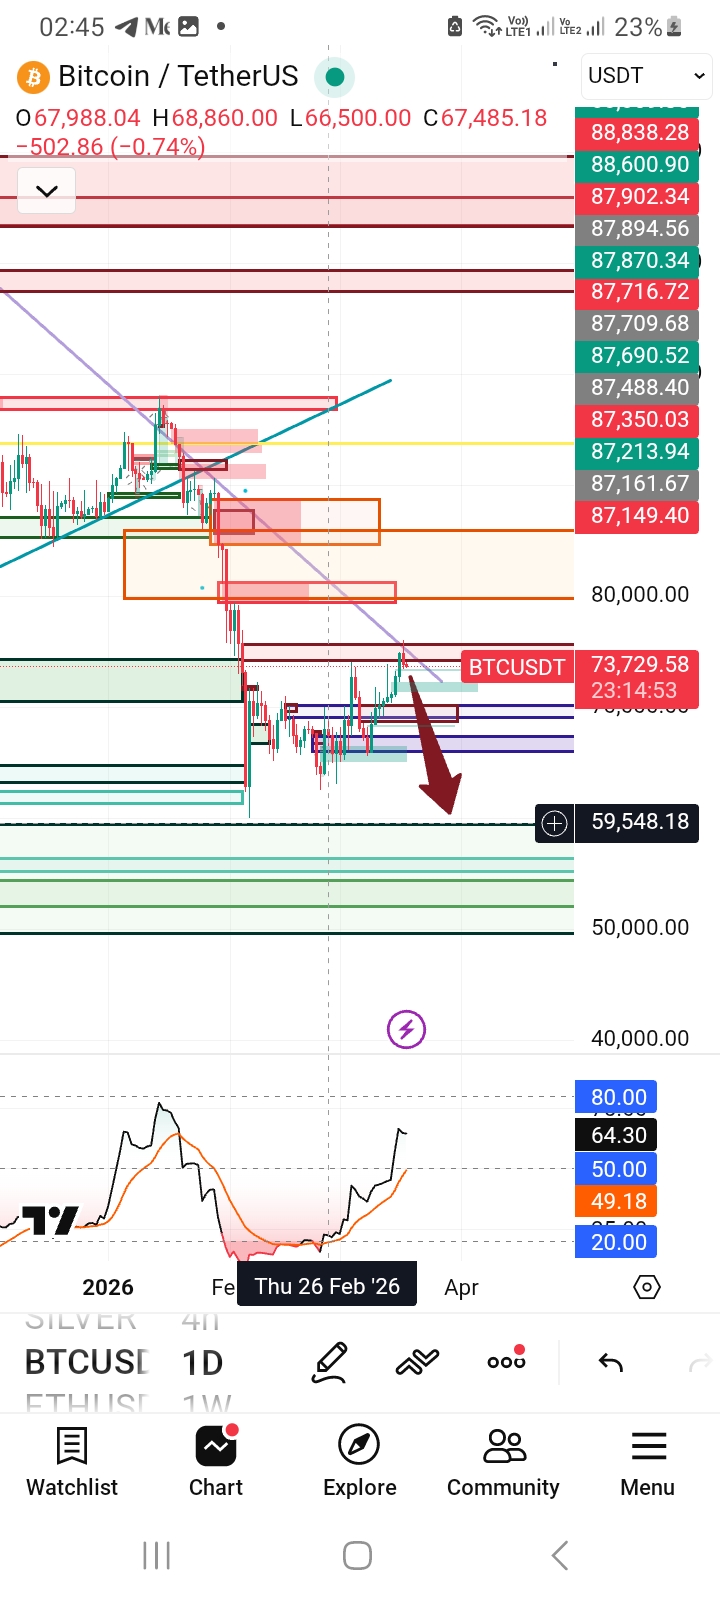
Immediate Support: $73,444 (recent swing low)
Pivot Resistance: $74,079
Key Rejection Zone: $74,700–$75,000
Downside Target (if breakdown): ~$59,500 (higher timeframe liquidity zone shown on chart)
Scenario Analysis
Bullish Scenario (Stabilization)
Hold above $73,444
Funding rates shift back positive
Outcome:
Retest of $74,079 pivot
Potential reclaim of $74.7K resistance
Bearish Scenario (Continuation)
Break below $73,444
Continued negative funding + falling open interest
Outcome:
Acceleration toward lower supports
Potential move into $60K–$59.5K liquidity zone (as indicated on chart)
- Market Context: Why This Matters
Unlike previous rallies driven by strong catalysts, the current market structure shows:
Low correlation with macro assets
High dependence on internal liquidity and leverage
Increased sensitivity to derivatives positioning
This makes the market:
More reactive
More prone to sharp moves driven by liquidations
Conclusion: Neutral to Bearish Bias in the Short Term
Bitcoin’s current pullback is a combination of:
Broad crypto market weakness
Technical rejection at key levels
Leveraged long unwinding
Key Takeaways
Short-term bias: Neutral → Bearish
Market is not in panic, but losing momentum
$73,444 is the key level to defend
What to Watch Next
Does Bitcoin hold or lose $73,444?
Are funding rates turning positive again?
Is RSI approaching oversold conditions?
A successful defense of support could trigger a bounce, while a breakdown opens the path for a deeper liquidity-driven correction.