LSK/USD Analysis and Buy Signal 8th Feb, 2018
LSK/USD:
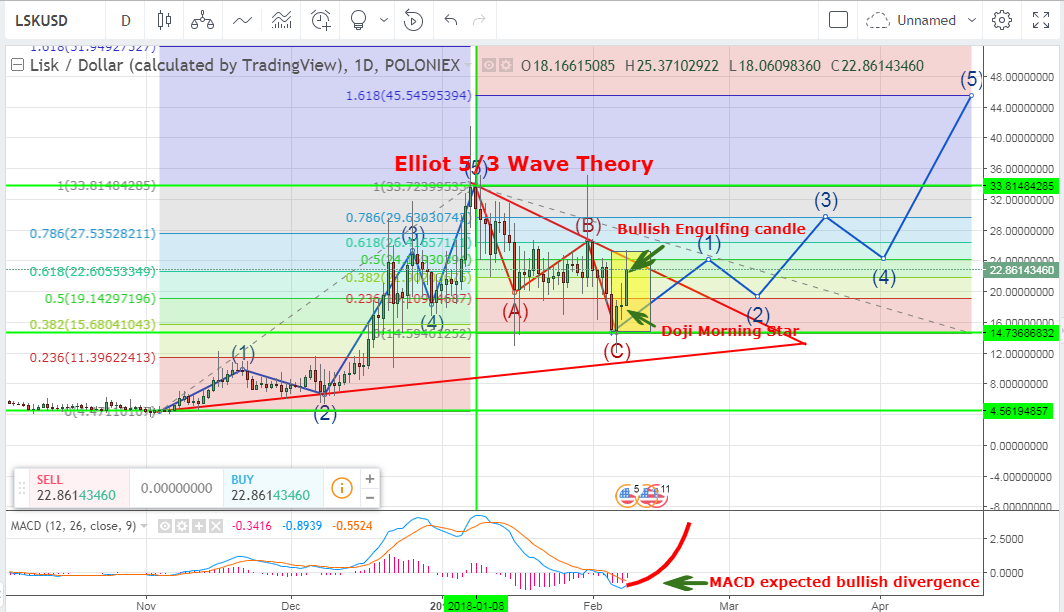
Buy range: $22-$25
Sell range: $30-$45
HODL: till infinity
Indicators:
- MACD
- Elliot Wave Theory
- Doji morning Star
- Bullish Engulfing Candle
- Fibonacci Retracement
Tradingview: https://www.tradingview.com/chart/LSKUSD/GjBc1Cnz-LSK-USD-Analysis-and-Buy-Signal-8th-Feb-2018/
Lisk (LSK) began its Elliot 5/3 wave on the 4th Nov, 2017 and completed its one to five (1-5) bullish wave at $33. 81 on the 7th Jan, 2018. It then embarked on a bearish three (3) waves ABC correction from $33.81 to $14.73. As at time of writing, LSK is trading between $18-$24 range.
A look at MACD on the daily chart, LSK looks ready for another bullish trend which resumed with 2 day bullish Engulfing candle and a Doji Morning star candle.
CAVEAT: The analysis is based Education, my opinion and trading decisions. Good luck and trade with caution.
Your Comments, suggestion and questions are highly welcomed
If this blog post has entertained or helped you to profit,
Please UPVOTE, FOLLOW, RESTEEM and/or consider giving some donations:
BTS Wallet - trizle1
BTC Wallet - 1AxEcPUi6nNQDaaT8CKTohmBKeYFhUJyFE
ETH Wallet - 0xDFf7E134291E1C82F98E3976be47BC3484F595B9
LTC Wallet - LbpwNMUYPj2uPMXh6RiDwvzap7UBtQGiAS
A bullish engulfing candle is a green candle bigger than the last red one ?
Correct
Coins mentioned in post: