What metrics enterprises use to measure ROI from LLM-Powered Solutions
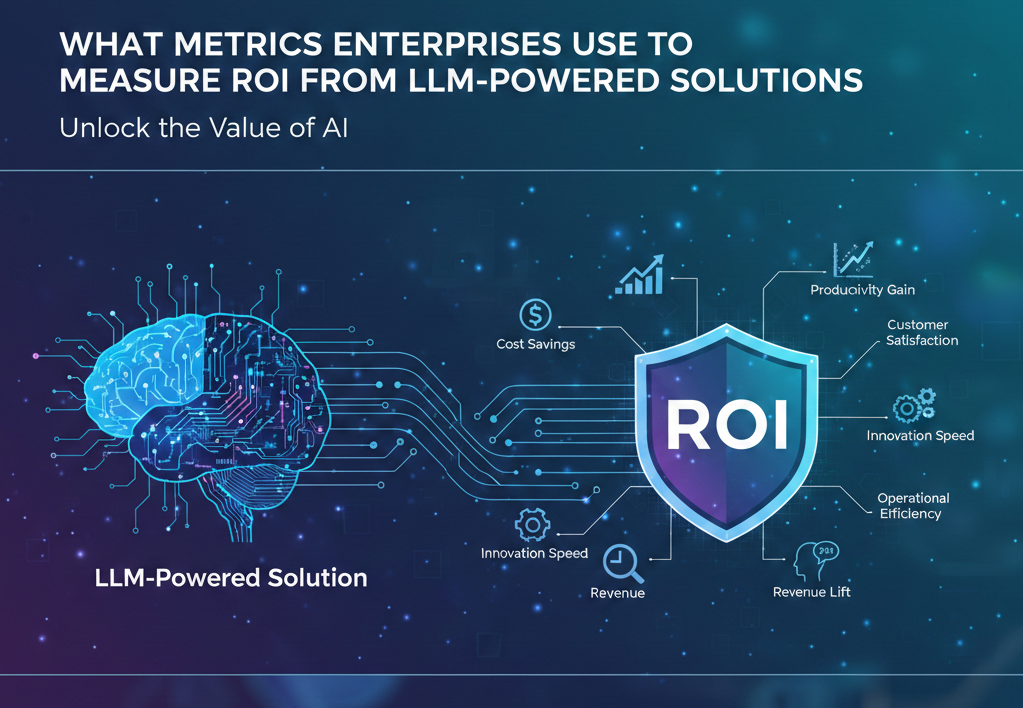
Large enterprises and well-funded startups do not usually put money into LLM-Powered Solutions on the basis of experiment alone. Leadership teams are expecting measurable results that are linked to cost control, revenue growth, operational efficiency, and risk reduction. As adoption matures, the measurement of ROI has come a long way from statistics of usage or accuracy scores from models.
This article describes the way decision-makers assess return on investment from LLM initiatives and how mature LLM Development Services couple technical performance with business impact. The focus remains on metrics that make a difference at the board and C-suite level and not surface-level indicators.
Why ROI Measurement for LLMs Is Different:
Unlike traditional software, LLM-Powered Solutions affect various levels of an organization simultaneously. A single deployment can impact customer support, internal knowledge access, product development and compliance workflows. Because of this, enterprises measure ROI for a combination of financial, operational, and strategic dimensions.
Organizations that rely on an experienced LLM Development Company will usually outline ROI benchmarks before the model training or integration process starts. This prevents the often-trap of measuring success after the deployment is done, when baseline data is missing.
Cost Efficiency Metrics:
1. Cost Per Task or Interaction
One of the first measures taken into account by enterprises is the decrease in cost per transaction. This includes:
- Cost per customer support interaction
- Cost per internal query handled by knowledge assistants
- Cost per document reviewed/summarized
2. Infrastructure and Inference Cost Control
Enterprises also monitor:
- Cost per thousand tokens
- Average inference cost for user session
- Utilization trends for cloud compute
This is a particularly important metric for global deployments where usage grows rapidly. Teams that rely on professional LLM Consulting Services often optimize architecture at an early stage to avoid usage-driven cost spikes.
Productivity and Time Savings Metrics
3. Hours Saved Per Role
Time reduction is still one of the most obvious ROI indicators. Enterprises track:
- Hours saved/employee/week
- Reduction in the volume of repetitive tasks
- Faster turnaround time for high-effort processes
For instance, legal, compliance and engineering teams often report measurable time savings from the first quarter of deployment.
4. Throughput Increase
Instead of just measuring time saved, advanced organizations measure output growth:
- Tickets resolved per agent
- Reports generated per analyst
- Features that are documented per sprint
Revenue Impact Metrics
5. Conversion and Retention Influence
For customer facing use-cases, ROI relates directly to revenue measures such as:
- Increase in lead to conversion rates
- Reduction in customer churn
- Increased engagement across digital touchpoints
LLM-Powered Solutions used in sales enablement or customer support tend to see an indirect revenue impact in two to three months, six months to nine months.
6. Faster Time-to-Market
Product teams also start to use LLMs for documentation, QA support, and internal research. Metrics include:
- Reduced product release cycles
- Reduced backlog size
- Increased speed of internal decision-making
Quality and Accuracy Metrics
7. Error Reduction Rates
Enterprises are measuring the reduction of human error in areas such as:
- Data classification
- Content review
- Knowledge retrieval
8. Response Consistency and Reliability
Consistency metrics include:- Diminishing of conflicting answers
- Improved standardization of response
- Reduced reliance on single subject experts
Risk and Compliance Metrics
9. Compliance Incident Reduction
In the case of regulated environments, ROI also includes avoided losses. Metrics tracked include:
- Reduced number of compliance violations
- Reduced time of audit preparation
- Increased speed in policy interpretation
10. Security and Data Governance Impact
Enterprises assess:- Data leakage events were prevented
- Effectiveness of access control enforcement
- Internal compliance rates of adhering to policy
Adoption and Usage Metrics
11. Active User Penetration
Usage metrics are still important when linked to outcomes. Enterprises monitor:
- Percentage of target users utilizing LLM tools actively
- Frequency of usage per role
- Trends in adoption over time
High adoption with low productivity impact indicates the need for workflow redesign and not replacement of the model.
12. User Satisfaction and Trust Scores
Decision-makers track:
- Internal user confidence ratings
- Reduction in manual check
- Feedback about output relevance
Strategic ROI Indicators
13. Internal Knowledge Leverage
One long-term measure that is often overlooked is how well organizations are reusing their internal knowledge. Metrics include:
- Eliminating duplication of work
- Quickening the time to onboarding new hires
- Increased re-use of historical documentation
14. Competitive Differentiation Signals
While harder to quantify, enterprises monitor indicators such as:- Ability to support new service offerings
- Improved customer perception
- Better data-driven decision culture
Connecting Metrics to Execution
Successful organizations don't track metrics equally. They pick a selected set based on business priorities and review benchmarks quarterly. This approach ensures that LLM investments remain linked to concrete results and not experimentation.
Enterprises that partner with teams that offer end-to-end LLM Consulting Services tend to have better ROI stories. Strategy, architecture, data governance, and integration planning are as much of a role as model performance does.
For organizations considering or scaling LLM efforts, aligning technical execution with business measures from day one is critical. When done correctly, LLM-Powered Solutions become transformative from operating as a cost center into measurable drivers of efficiency, growth, and resilience.