Do Companies Purposely Mislead?
I am sure you’ve heard or seen it before…the random post spewing some percent, statistic, fraction, ratio, data, etc. to make a point. Maybe it's from a credited source with evidence and research to support it. But most likely it's some old out-dated information. Or maybe it's not actual data at all, but rather made up numbers picked out of the air. What I've come across many times these past few months on social media are things like...
- "The unemployment rate has dropped x % since..."
- "Crime has risen y % with [fill-in-the-blank] in charge."
- "The debt has risen/dropped z % since last year and it will be x quadrillion dollars in 2050."
Perhaps relying on social media for factual information is the problem. I know it’s not a new trend or phenomena and I can go on and on with examples. All I'd need to do is open up Facebook at this very moment and find any political discussion for/against any political party or stance, and in less than 10 seconds I can quote a "statistic" from a post. But really that's not my intention. What stands out to me in these claims are they are not actually followed up with relevant credible evidence, facts, sources, or data (or if present, at the very least, a biased one-sided view that doesn’t present all the information…just the bits to fit the argument), and then presented as "fact".
Living in Chicago, there is certainly a split between North-side baseball fans (Cubs) and the South-siders (White Sox). The Cubs dominate 72% of the city’s fan-base compared to 28% support for the White Sox. Where did I get these figures from? Well…I made them up! It’s purely based on my perspective and perception. No data. No evidence. No facts. No sources. No studies. But is it wrong?
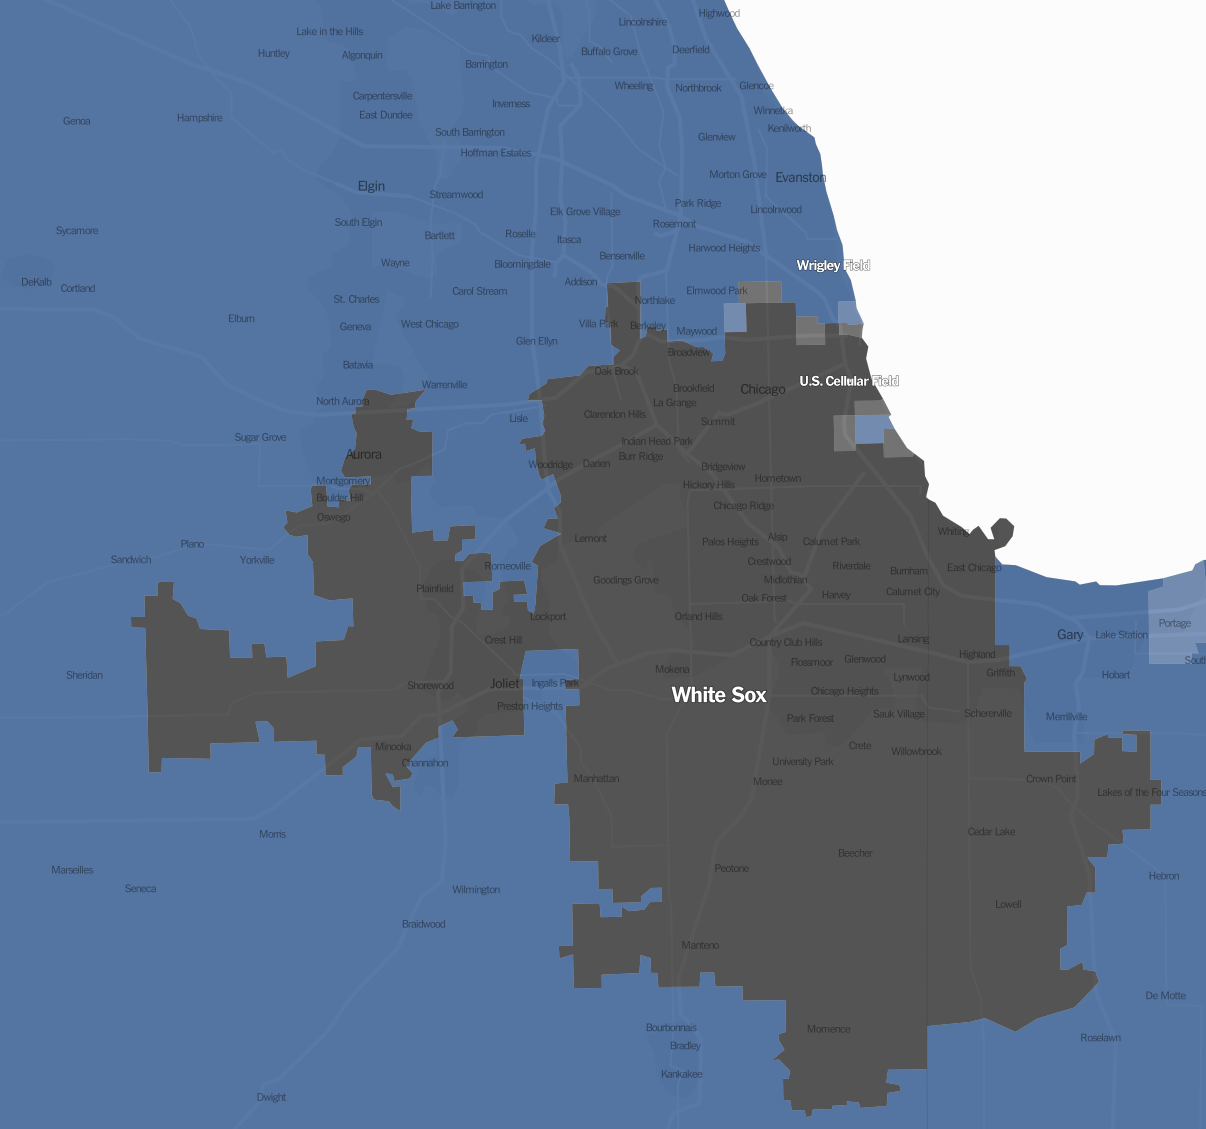 If you want to see some not-made-up numbers of the Chicago Baseball fan-bases, check out https://www.nytimes.com/interactive/2014/04/23/upshot/24-upshot-baseball.html?_r=0
I admittedly am guilty as charged at doing this. However, since beginning my Masters in Data Science 6 months ago, I’ve grown a huge appreciation to not arbitrarily throw around made up numbers to make a point. I’ve also learned to take someone’s claim with a grain of salt, and if it’s a topic that is really of interest to me, then I’ll investigate it myself.
So many different studies. Who do we believe?
Why do we do this? I think there are a few reasons (and please share your thoughts as well in the comments).
- It’s certainly easier and less time consuming to just take someone’s word for it than to actually look it up, do the math, etc.
- We can justify a number with our own experiences (as I did above with what I feel is a reasonable split between Cubs vs White Sox fan-base in Chicago. Certainly, since I have lived IN Chicago for 30+ years, I can feel to be somewhat of a credible source to “calculate” those percentages).
- Sometimes there are so many conflicting reports that we just don’t know which one is true or who to believe. So we try to determine or pick the results that fit our point of view, what we want to believe, and throw away the others.
- We just don’t understand the fundamentals of the math involved or the question being asked.
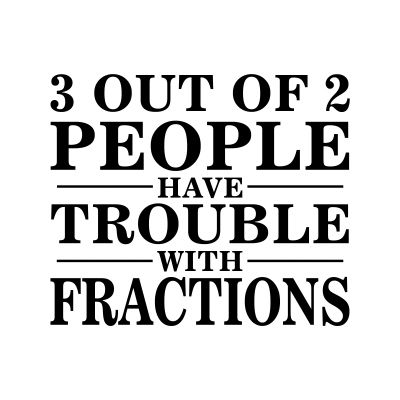
I displayed this in my classroom and I made sure my students understood this joke
Are We Taken Advantage Of?
It’s one thing to casually throw stats on a wall to see what sticks in a conversation, whether it’s on Facebook, Steemit, etc. I understand those are public forums and a means to have discussions (hopefully respectful). But when companies, media, or governments do it, aren't they slipping into an area of being unethical, deceptive, and misleading?
Knowledge is power, and that is one point I always tried to get across to my math students. If someone has an agenda, whether it is to persuade your beliefs or to get you to buy their product, you need to think for yourself and do not take their word for it.
The Reason of Today's Post
So with all that said, here's what inspired my post. My professor recently planned a trip to France and purchased off Amazon the breathalyzers that the French police like you to carry.
He then received an email from the seller asking to give feedback, including the seller’s website which included the chart below. He then posed the question to us...."Those figures look pretty compelling, but are they correct?"
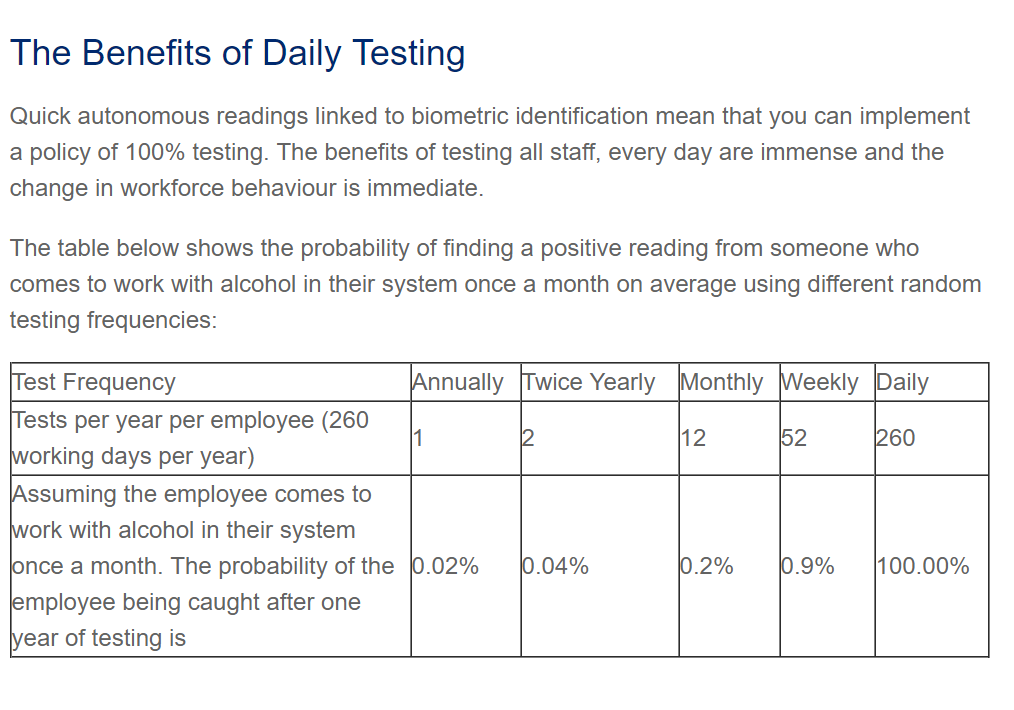 The table above can be found at http://alcosense.co.uk/alcosense/alcosense-trutouch.html
The company makes a pretty compelling argument that you would need to buy their product, but is it necessary?
Did I Hear Say Someone Say “Let’s Do a Monte Carlo Simulation”?
http://www.palisade.com/risk/monte_carlo_simulation.asp gives a nice explanation of a MCS.
“Monte Carlo simulation performs risk analysis by building models of possible results by substituting a range of values—a probability distribution—for any factor that has inherent uncertainty. It then calculates results over and over, each time using a different set of random values from the probability functions."
I set up a Monte Carlo Simulation in R to actually test this scenario out as described in their chart. I won’t go into great detail as this post isn’t necessarily about the coding or R of a MCS, but rather to share my results.
The Quick Explanation of How It Worked
So, imagine a set of numbers 1 to 260. Each number represents a working day.
We will have 2 sets of numbers. Let’s call them:
d = the set of days employee is drunk
t = the set of days employer tests
The simulation randomly takes 12 numbers, without replacement, out of the 260 working days (set d: the days the employee comes to work drunk).
The simulation randomly takes 52 numbers (simulating a weekly testing frequency) , without replacement, out of 260 (set t: the days tested).
To “catch” a drunk employee after 1 year of testing, all the simulation needs to do is see if there’s one single match (when d = t) between my set of days the employee shows up drunk with the set of days the employer tests. If there’s a match (doesn’t matter if it’s the first number in the set of testing days or the last number in the set of testing days), we can say that the employee was caught within the year...which is the calculation the chart claims.
The wonderful thing about Monte Carlo Simulations is we can run this simulation thousands (or millions) of times to get a more accurate percentage of how many times an employee is caught within a year of testing. And the results of testing weekly are….
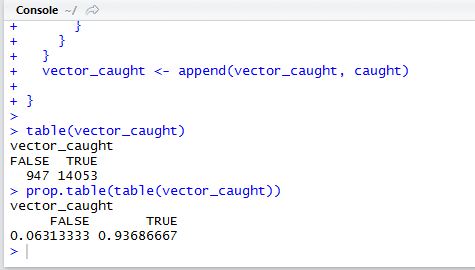
TRUE means there was at least 1 match between the two sets, meaning the employee was "caught" within a year of testing. I ran the simulation 15,000 times resulting in over 93% chance of being caught! I must have done something wrong!
No, I do not believe the simulation is wrong. The numbers this company presented to us are misleading. If a company were to test weekly and an employee was under the influence on average 12 times in a year, that employee would have over a 93% chance of being caught within a year! Quite a difference compared to their 0.9% chance.
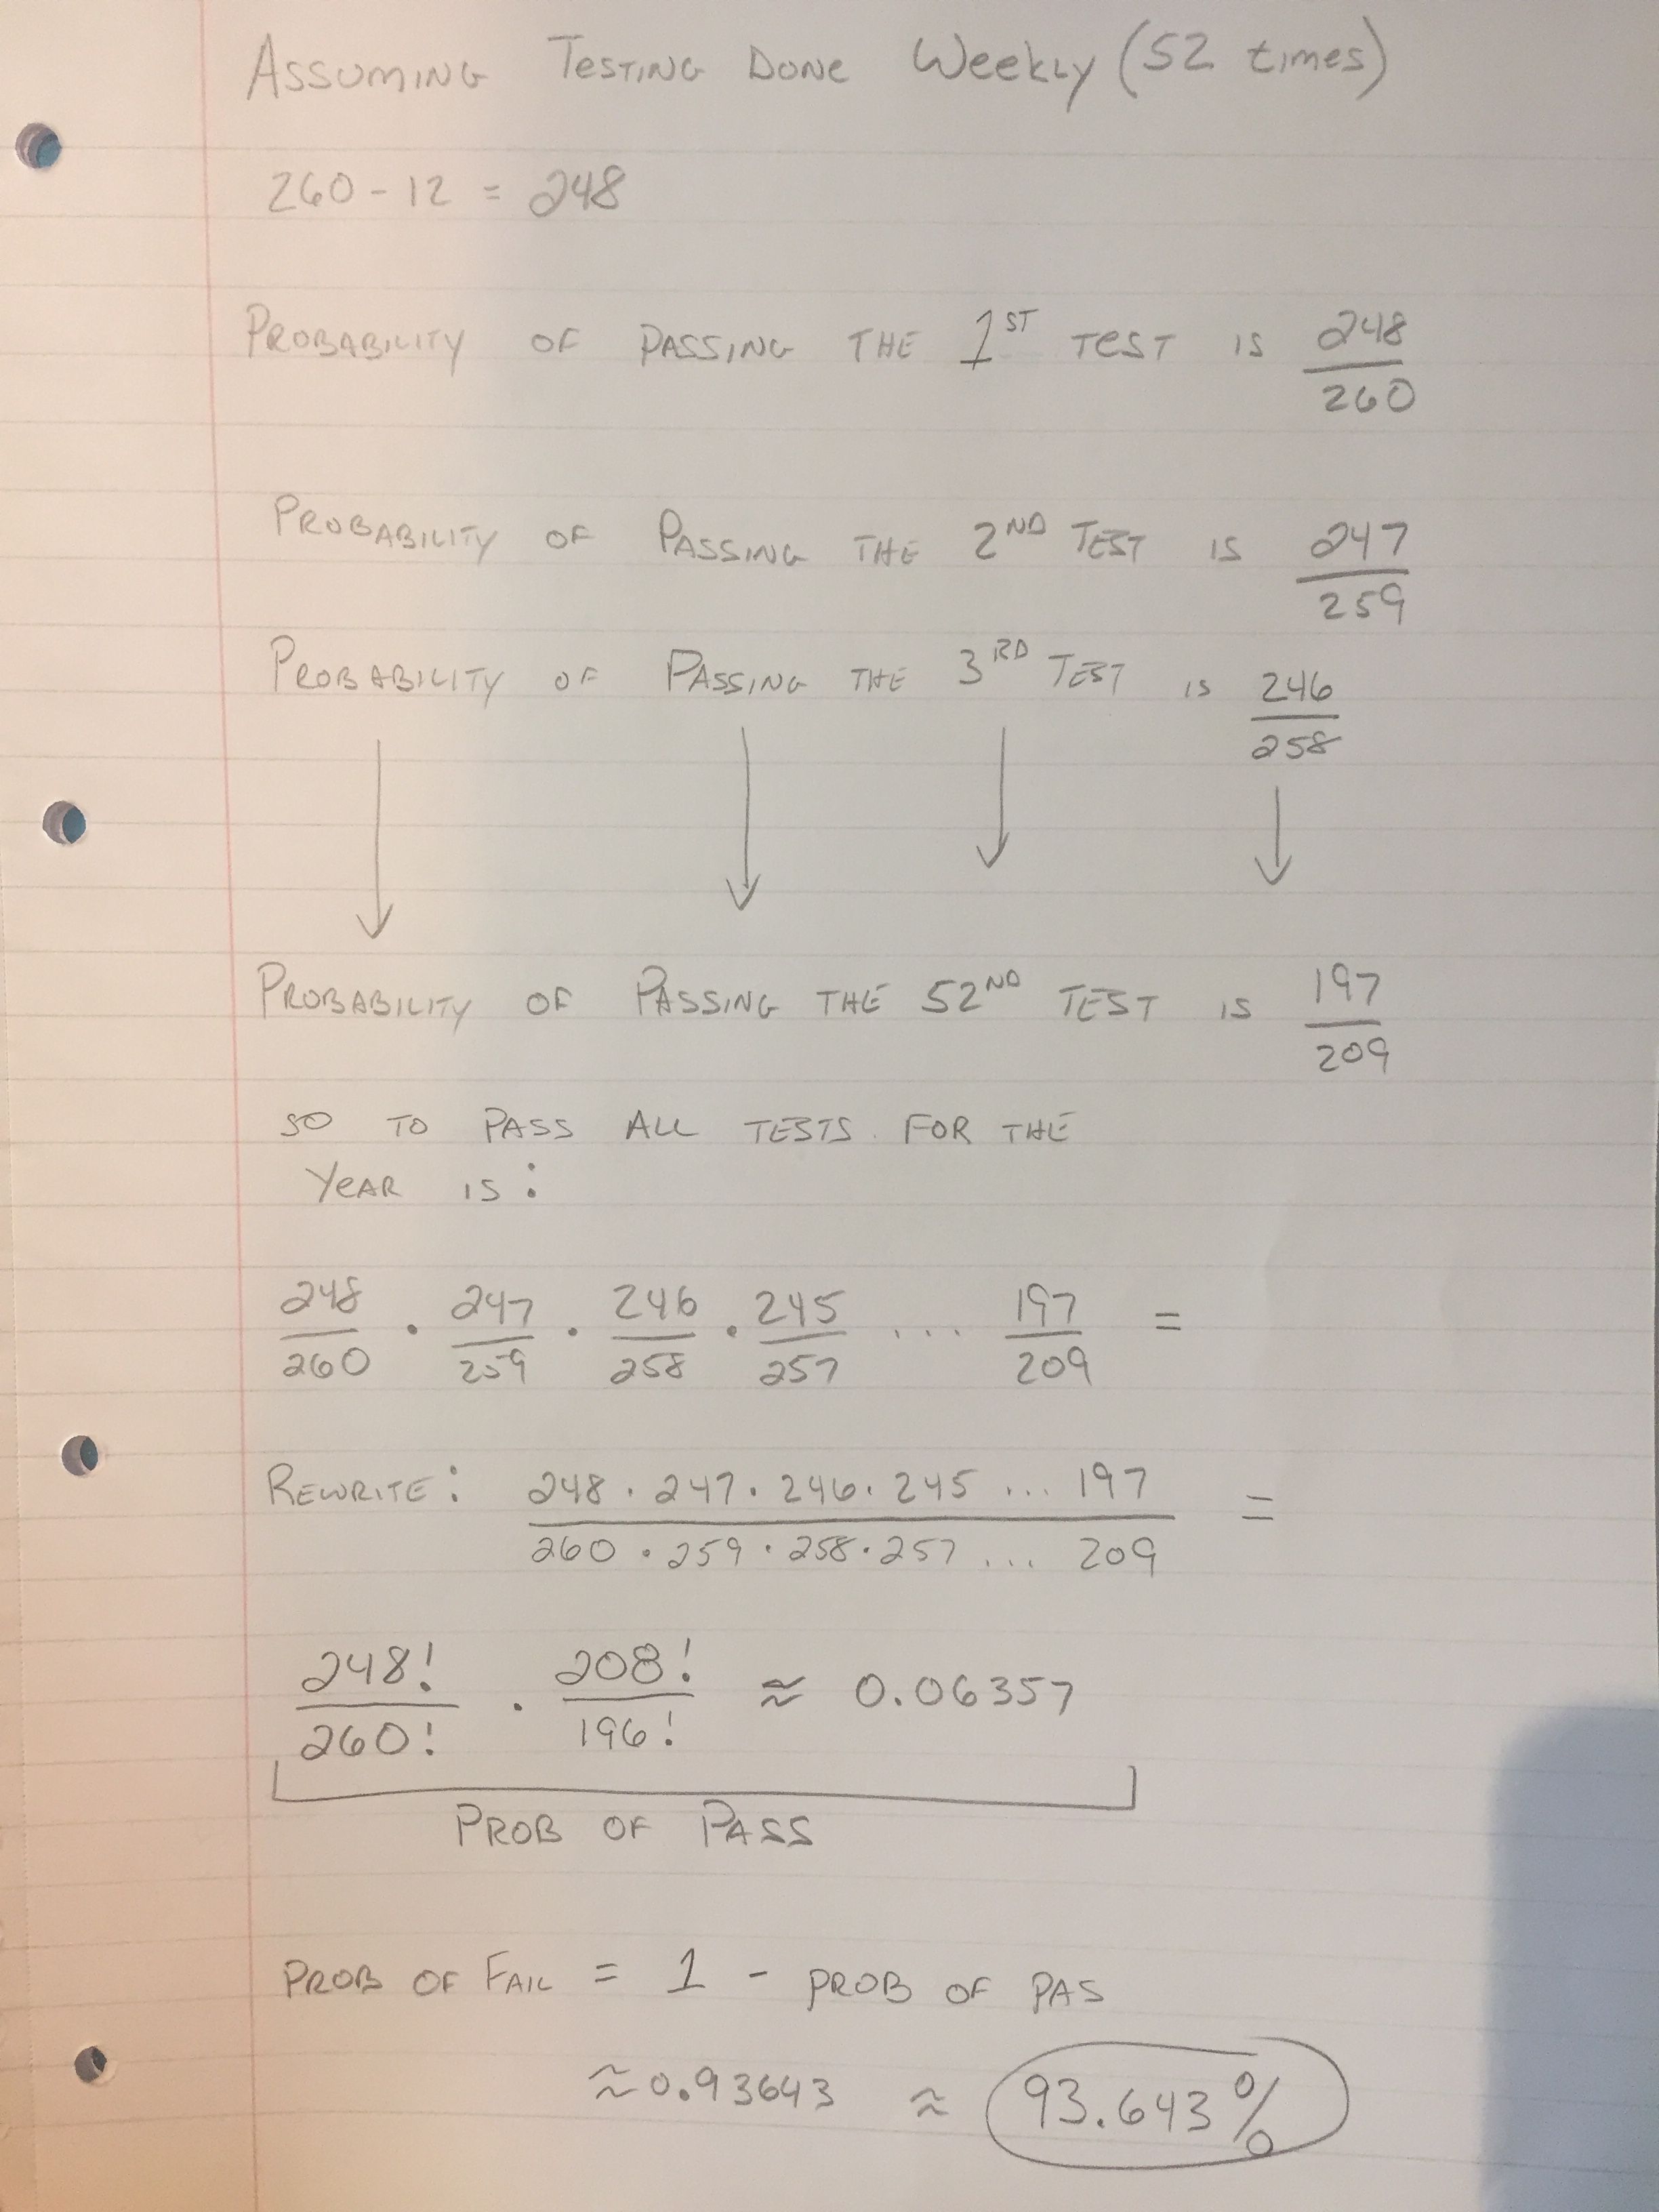
So Where Did They Get The 0.9% From?
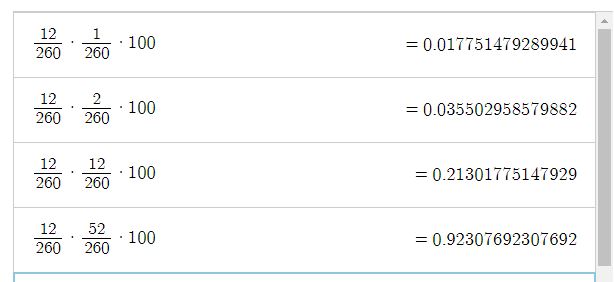
Their probabilities are not necessarily made up. When calculating the probability that 2 independent events will occur, you multiple each of those events' probabilities. It appears they multiplied the probability of the employee being drunk within a year (12/260) by the probability of days tested within a year (x/260). This is purely my assumption as to how they calculated the probabilities in the chart. But I feel confident in my assumption, in that these values do match their table when rounded (with the exception of testing daily).
Note: This is my assumption of how they calculated the probabilities. I could not find their actual source/work.
These figures are correct if we were to determine the probability of picking 1 random day from the working days that were both a day the employee is drunk AND a day the employer tested.
For example, looking at "Test Frequency - Weekly":
P(drunk) = 12/260
P(tested) = 52/260
P(drunk AND tested) = 624/67600
BUT, that's not what they claim in the narrative. Their exact words are, “The probability of the employee being caught after one year of testing”. It is NOT the probability of randomly selecting 1 day out of the year that the employee was caught.
However, they conveniently did not make that mistake in the probability calculation when testing daily.
So now the question is, are they purposely misleading the consumer, did they just choose the wrong wording, or do they not understand the fundamental difference in what they are claiming/asking and what they are calculating?
That is for you to decide. But I will supply my evidence and work. And as I stated from the start…do not take my word for it, check my work or try it out on your own.
Thanks for reading!
Here's My Work
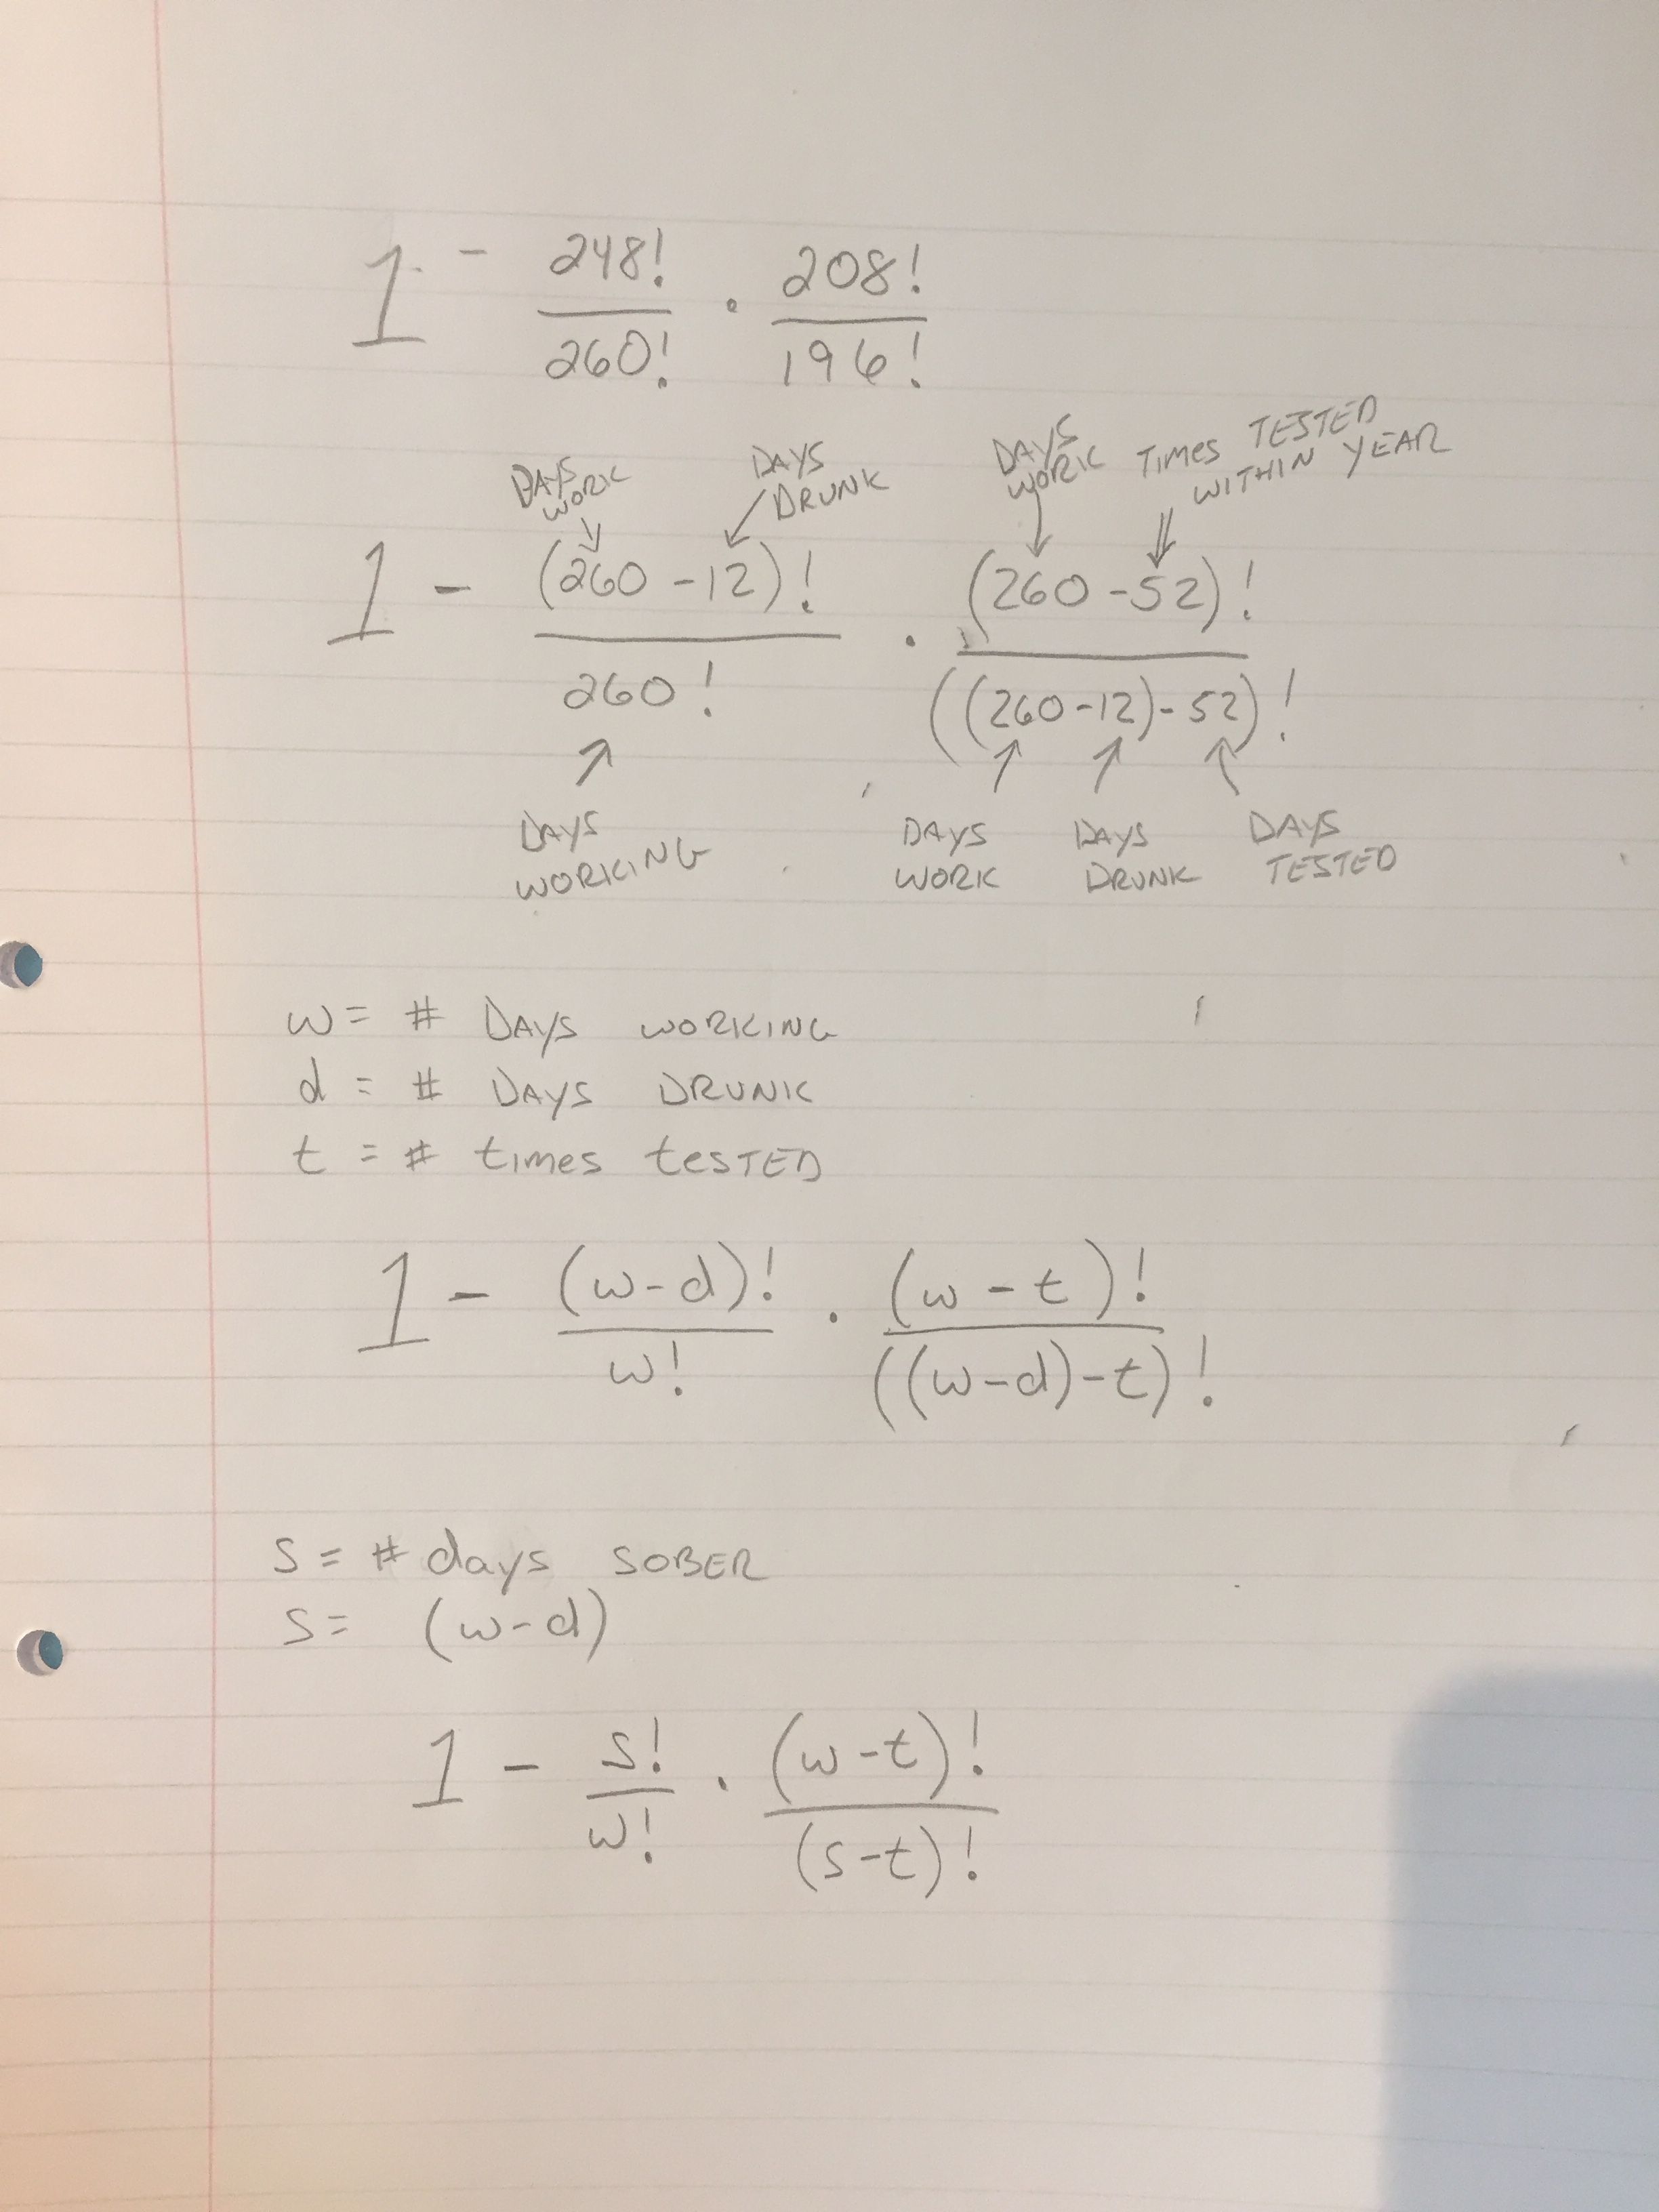
Calculating a formula for R
library(Rmpfr)

working = readline(prompt="Enter number of working days within a year: ")
drunk = readline(prompt="Enter number of days drunk at work within a year: ")
test = readline(prompt="Enter the number of days testing within a year: ")

# convert character into integer
w = as.integer(working)
d = as.integer(drunk)
t = as.integer(test)

#Testing with Given Values
#w = 260
#d = 12
#t = 52

sober = (w - d)
y = (w-t)
z = (sober-t)

s_fact = gamma(as(sober,"mpfr"))
w_fact = gamma(as(w,"mpfr"))

y_fact = gamma(as(y,"mpfr"))
z_fact = gamma(as(z,"mpfr"))

if (y == 0){
  y_fact = 0
}

if (z < 0){
  z = abs(z)
  z_fact = gamma(as(z,"mpfr"))
}

prob = 1 - ((s_fact/w_fact)) * ((y_fact/z_fact))
prob_caught = as.numeric(prob)

print(paste("You have a", prob_caught, "chance of being caught."))
Code in R to Calculate Different Scenarios
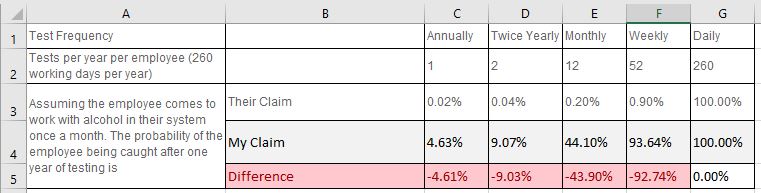
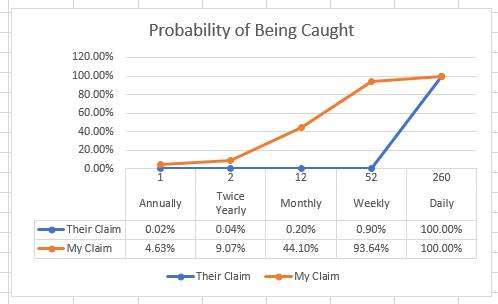
My Calculations vs Their Calculations
The world is too random for events to be predicted by statistics.
Whether it's Monte Carlo or anything that we humans come up with there is no way we can predict events in the future.
When the guy who wrote "The Signal and the noise" was completely wrong and so many others who try to predict the future with historical data are "fooled by randomness" (check this book too), we can stop trying to think that statistical significance can predict human behavior.
Whether they do it on purpose or not, just expect that those company reports have no idea what they're talking about.
I'll have to read those two. I agree with you 100%. Obviously the desire to know or predict the future could be beneficial in society on so many levels (and in some cases detrimental, depending on who would use it for selfish reasons and how that knowledge would be used).
You bring up a good point. But by just changing one word in how I view statistics, I believe, makes it fundamentally different to me. For me, statistics is more about calculating the risk or finding how likely something could occur, not how likely something will occur.
Congratulations @stats-n-lats! You have completed some achievement on Steemit and have been rewarded with new badge(s) :
Click on any badge to view your own Board of Honor on SteemitBoard.
For more information about SteemitBoard, click here
If you no longer want to receive notifications, reply to this comment with the word
STOPGood post
This post is very insightful. Thank you for sharing it with us! You did a fantastic job with exploring this topic and relaying important information to us so that we can understand how serious this issue is. I think it is important that we often take a step back and look at how we handle life and circumstances. I believe that this post will help many of us do just that. Thank you!
Very interesting.
Is there a chance that 0.9% is meant to be a 0.9 correlation between people being drunk at work, and being caught drunk?
I think they are pretty clear that they are presenting it as the probability of being caught and not the correlation. It appears they're trying to show the dramatic increase between testing weekly (52 times) vs daily (260 times), and why it would be cost effective for you (the employer) to test daily.
Gotcha. Great piece.
Many thanks for sharing this article!
Nice post.
Is anything ever the complete truth? Everything is manipulated by the person presenting the information. Just look at the different news channels. Do you hear what you want to hear? So statistics really matter? Just look at who the President is and how he got there.
Why did I feel so stupid reading this???? I need better math in my life!!!
@flashbid, don't feel stupid. We're all here to learn and share our passions with each other. So please ask any questions or for clarification...no matter how basic or "stupid" you think it is...no one will judge (P.S. if it makes you feel more comfortable, my wife stopped reading it when she didn't understand the whole "exclamation points" in my shown work).
Thank you for sharing this helpful information