Steem Total Value Powered Up - $32 million - August 6, 2023
This is next in my series of posts reviewing the amount and value of powered up STEEM on the Steem blockchain. For previous posts, see the end of this entry.
Noteworthy in the last week |
|---|
- Week over week, the number of powered up STEEM decreased by about 67 thousand SP, or 0.04%.
- Over the course of the week, we saw two daily increases and zero new highs in the number of staked STEEM.
- The modeled value of powered-up (staked) STEEM lost ground against all comparison tokens, except for LTC and TRX.
- Changes ranged from -33/5% against USD to +97/10% against LTC.
- Compared to the January 1, 2023 baseline, the modeled value has lost ground against BTC, ETH, and TRX. It has gained ground against LTC, SBD, and USD.
- This week's completed powerdowns were reported at 633K, which is an increase of about 44% from last week's 441K.
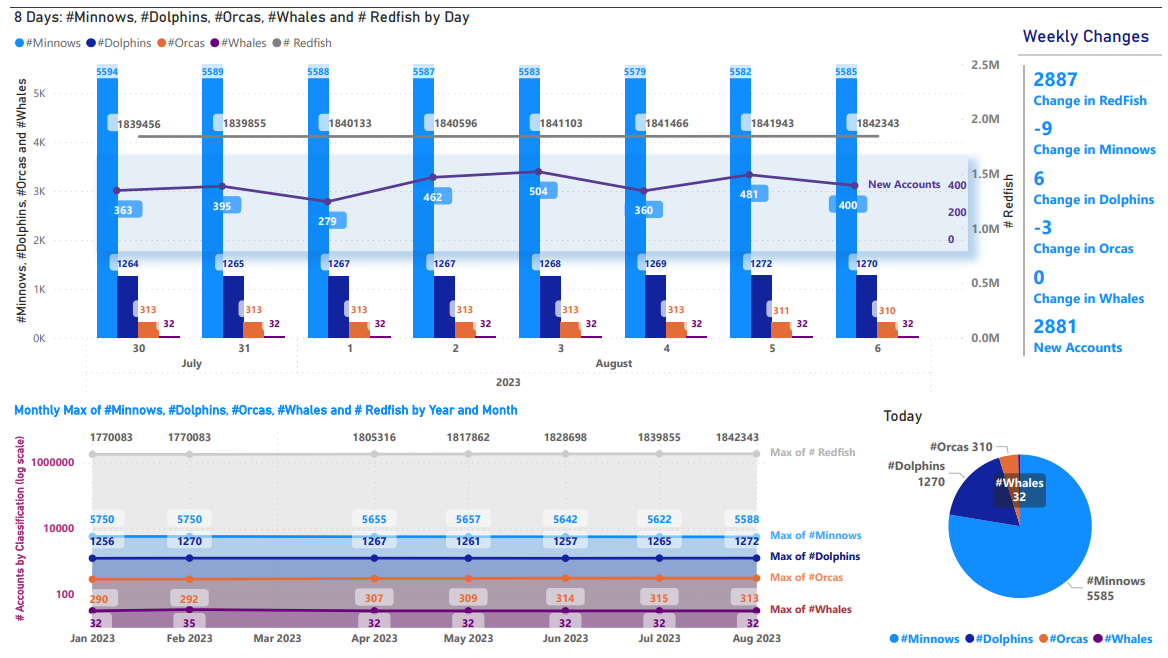
- We saw 2,881 new accounts created - up from 1,675 last week.
- Net migrations of account classifications showed 3 fewer orcas, 6 more dolphins, 9 fewer minnows, and 6 more redfish. The number of dolphins, 1,272, represents the highest value since I began tracking. The number of minnows, 5,585, is continuing a generalized multi-month general decline.
- It might be interesting to watch the LTC model in coming weeks, since the third halving happened on Wednesday.
Here are the numbers as-of a few minutes ago |
|---|
Total value locked in powered-up STEEM (USD): $32,378,956.63
External STEEM market cap (coingecko) $80,574,847.59
Internal STEEM market cap (median_price * current_supply) $81,082,300.00
Locked value in terms of other tokens:
| token | price | locked value equivalent | Jan 1, 2023 | pct of Jan 1 baseline |
|---|---|---|---|---|
| tron | $0.08 | 419,873,393 | 445,758,870 | 94.19% |
| steem-dollars | $2.32 | 13,956,446 | 11,564,498 | 120.68% |
| bitcoin | $29,056.00 | 1,114 | 1,477 | 75.46% |
| ethereum | $1,831.65 | 17,677 | 20,406 | 86.63% |
| litecoin | $82.59 | 392,044 | 344,287 | 113.87% |
| steem | $0.18 | 176,941,924 | 166,882,703 | 106.03% |
| USD | $1.00 | 32,378,957 | 24,516,738 | 132.07% |
|
|---|
This slide (new after April 16, 2023) takes its data from steemchiller's SDS getVestingStats API call.
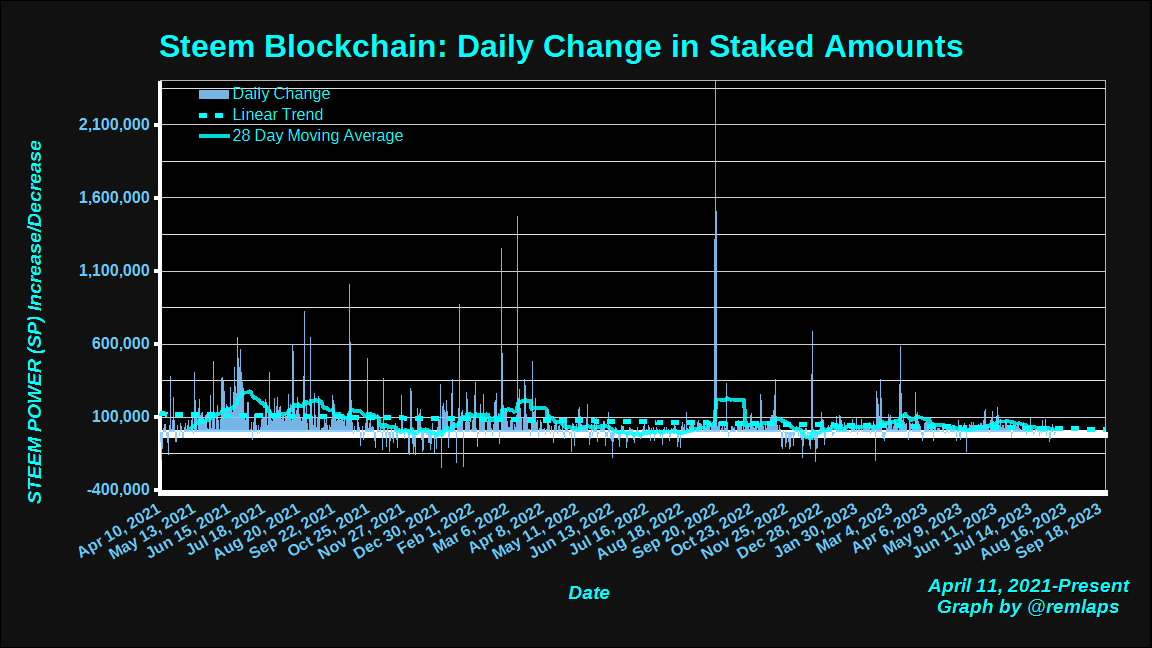
Daily Changes
Here is a chart of daily changes in powered-up STEEM from April 11, 2021 to present. The graph also includes a linear trend line and a 28 day moving average..
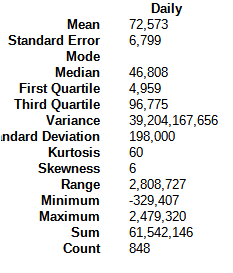
Here are some descriptive statistics, for numbers geeks.
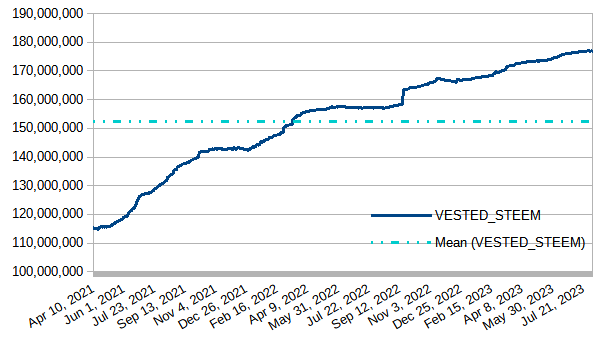
VESTED STEEM
Today's downloaded value was 176,937,371, which was down by about 67K STEEM, or about 0.04% from last week's observed value. The long-term upslope remains just barely perceptible in the graph.
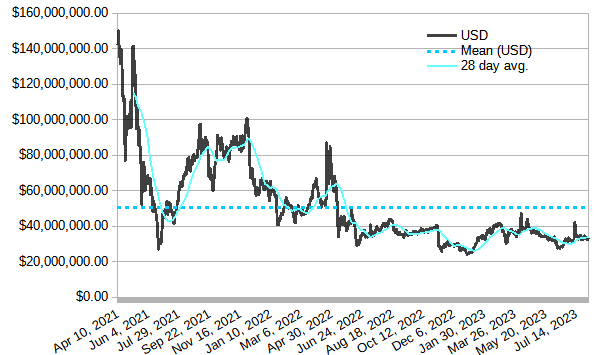
Modeled value of powered-up STEEM in terms of USD
In terms of USD, today's value at download time - about 321/3 million - remains higher than the December 30, 2022 low of $23,718,335.58. It declined about $1.2 million, or 3.6%, during the week.
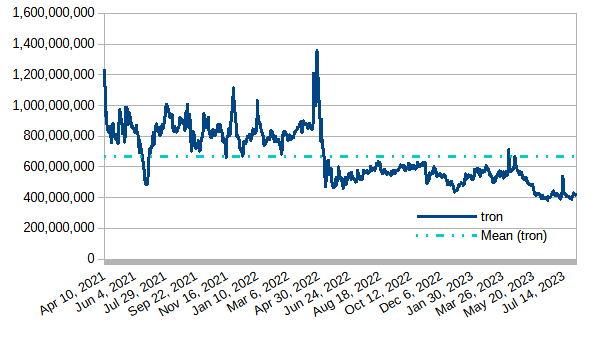
Modeled value of powered-up STEEM in terms of Tron (TRX)
Powered-up STEEM gained about 71/2 million against TRX or a bit under 2%. This value is currently about 36 million above the June 15 low of 384,259,742.
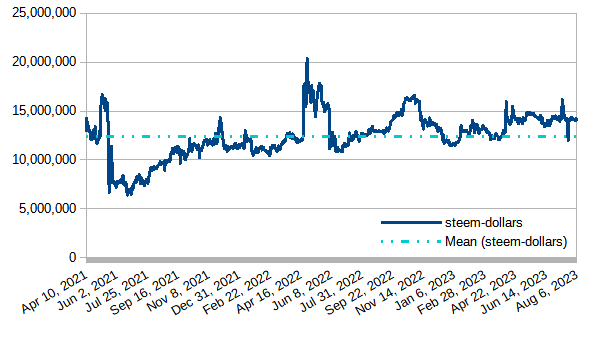
Modeled value of powered-up STEEM in terms of Steem Dollars
Powered-up STEEM declined by about 220K SBDs, roughly 11/10%, during the last week.
Modeled value of powered-up STEEM as a percentage of Steem's market cap
With today's observed value of 40.12% the graph basically flat for another week. It dipped below 40% on Thursday (August 3), and climbed back above on Friday. We have now seen 3 days above 40%; 489 consecutive days above 39%; 553 consecutive days above 37%; 680 consecutive days above 35%; and 743 straight days above 1/3. The graph continues to show some noise in recent weeks.
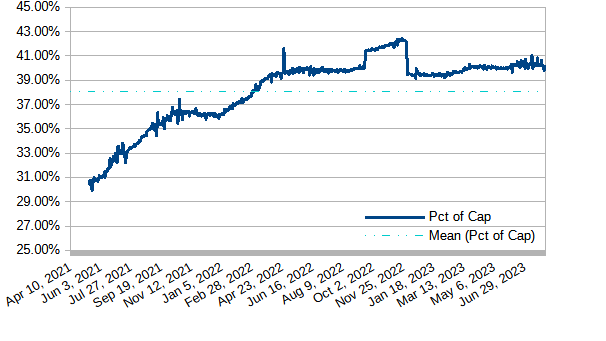
*As previously reported, the big drop on December 4, 2022 was due to a correction in the value that Coingecko is getting for its circulating supply. Numbers before December 4, 2022 were based on an artificially low supply measurement.
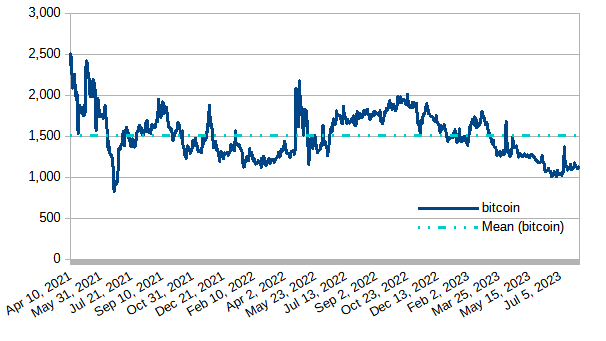
Modeled value of powered-up STEEM in terms of bitcoin (BTC)
Powered-up STEEM declined by about 29 BTC, or 21/2%.
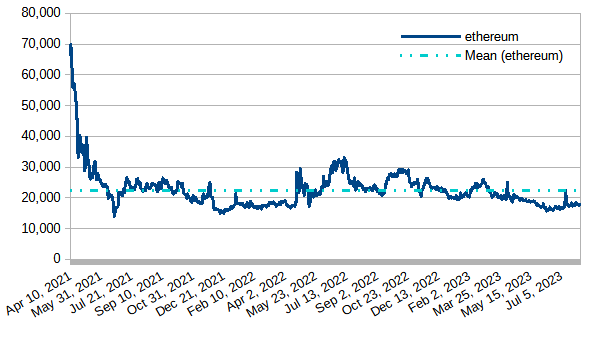
Modeled value of powered-up STEEM in terms of Ethereum
Powered-up STEEM lost ground against ETH in the last seven days, this week's decline was about 200 ETH, or a bit more than 1%.
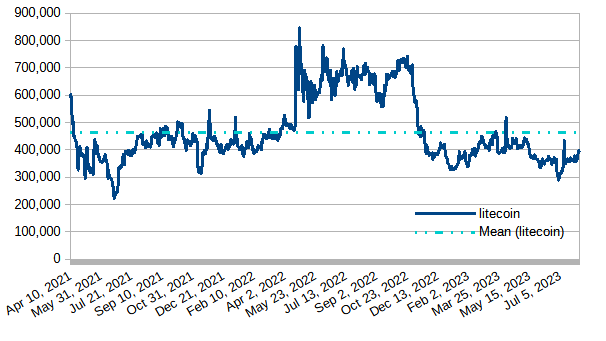
Modeled value of powered-up STEEM in terms of LTC
The weekly change for powered-up STEEM against LTC was an increase of about 35K LTC, or almost 10%. The 3rd LTC halving happened on August 2, so it might be interesting to watch this chart in coming weeks and months.
Daily Powerdown Activity
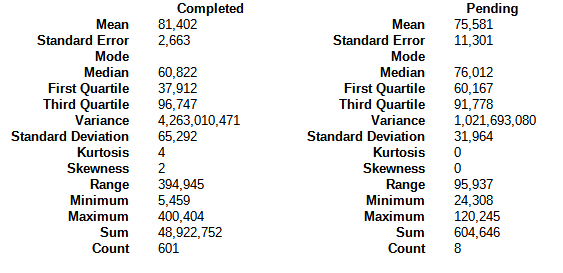
Here is graph with data from steemdb.io to show daily completed and pending powerdown activity. The graph shows 633K in completed powerdowns last week and 599K pending (both measured from Sunday through Saturday[GMT time zone]). This represents a potential decrease in powerdowns by about 12% or more.
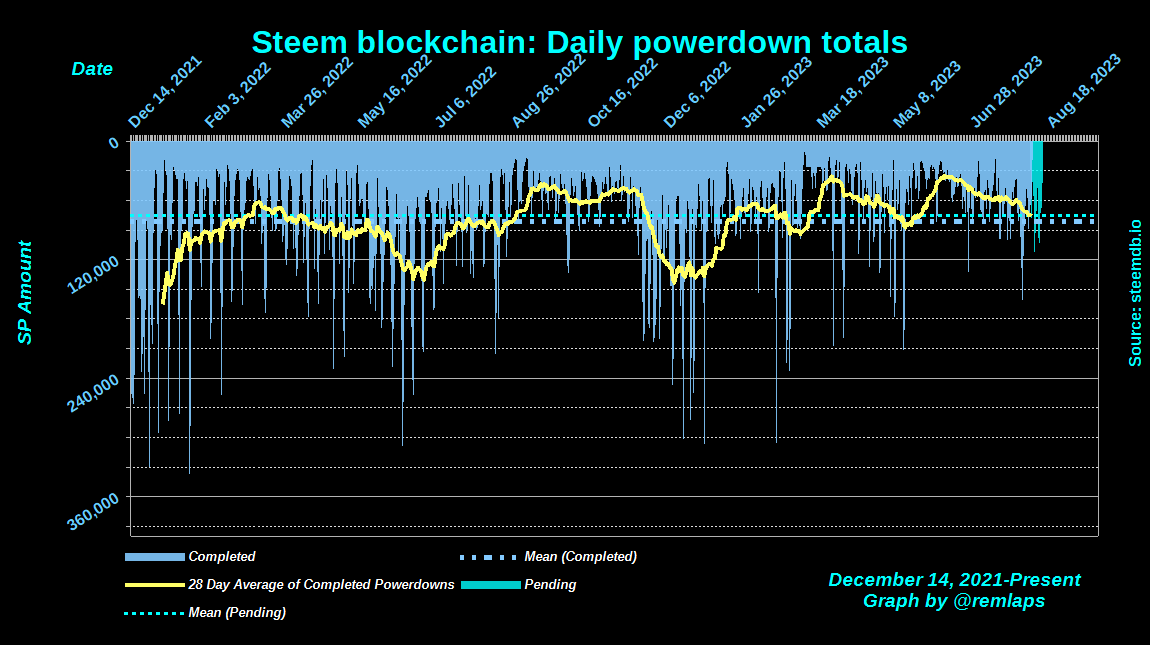
The horizontal lines are the average values for completed (blue) and pending (cyan) powerdowns, and the yellow line is a 28 day moving average of completed powerdowns. "Pending" numbers now come from the Steemit API, not from steemdb.io.
Here are some descriptive statistics for the numbers geeks
| And with a total of 1,062 pending power downs (up from 930 last week), here are the times, dates, and amounts of the top-10 |
|---|
1 2023-08-06T22:40:36 - 94,403,025 VESTS, 53,797 STEEM
2 2023-08-08T22:45:33 - 61,565,834 VESTS, 35,084 STEEM
3 2023-08-13T09:48:57 - 59,432,521 VESTS, 33,868 STEEM
4 2023-08-11T21:29:09 - 57,260,474 VESTS, 32,631 STEEM
5 2023-08-11T21:28:18 - 50,833,447 VESTS, 28,968 STEEM
6 2023-08-12T10:15:18 - 50,306,881 VESTS, 28,668 STEEM
7 2023-08-06T22:01:24 - 35,170,189 VESTS, 20,042 STEEM
8 2023-08-11T20:54:39 - 30,274,734 VESTS, 17,252 STEEM
9 2023-08-09T06:44:45 - 29,491,248 VESTS, 16,806 STEEM
10 2023-08-09T17:37:06 - 25,898,905 VESTS, 14,759 STEEM
Notes
- Reference prices for STEEM and other tokens are downloaded from coingecko.com
Previous posts
- Steem Total Value Powered Up - $32 million - August 6, 2023
- Steem Total Value Powered Up - $33 million - July 30, 2023
- Steem Total Value Powered Up - $34 million - July 23, 2023
- Steem Total Value Powered Up - $34 million - July 16, 2023
- Steem Total Value Powered Up - $32 million - July 9, 2023
- Steem Total Value Powered Up - $32 million - July 2, 2023
For links from 2021, 2022 and the first half of 2023, see these posts:
- Steem Total Value Powered Up - $32 million - June 25, 2023
- Steem Total Value Powered Up - $67 million - January 2,
20212022 - Steem Total Value Powered Up - $36 million - June 26, 2022
- Steem Total Value Powered Up - $26 million - December 18, 2022

Pixabay license, source
Reminder
Visit the /promoted page and #burnsteem25 to support the inflation-fighters who are helping to enable decentralized regulation of Steem token supply growth.
This is a complete weekly report on steem, tron and compared to other coins terms. Power up is a good investment that I always try to do. For me having more steem means having more asset that going to bring a great amount when it will be bull market. I just hope I can hold tight steem for the right time. Thanks for this informative blog, helpful indeed!
Thanks for the analysis, I didn't like this week's data. There is a decrease in the amount of Power Up. I wish the old level to come out in the coming weeks
Not sure if it was more due to a decrease in power-ups or an increase in power-downs, or maybe both. But yeah, a few weeks ago, I thought we were sneaking up on 41% of market-cap powered up, but after the last two weeks, that seems further away.
I generally sell my TRON, I sell them and I buy satoshis, I think that in economic value it brings me more profits.
i powered up 3 steem this motnh 😎
Very perfect description. I like the publication that you do, share it because we know about steem and steem prices are now very stebil thanks for sharing quality posts links
Regards @remlaps-lite
Thanks for the helpful research and weekly reports. They are important to the platform.
TRХ I think they will be turned off for accruals soon. Now it was made with a ratio of 0.25 and in reality 0.2. Well, time will tell!