Bitcoin up or down ????

Hello guys
Today I'll introduce market behaviour of Bitcoin & price analysis .
So please read till end
Bitcoin traded largely sideways over the last 24 hours, though a dip soon before press time may threaten a developing bullish chart pattern if the price moves below $6,000.
BTC's drop below the 10-day moving average on Tuesday neutralized the immediate bullish outlook and shifted risk in favor of a sell-off to $6,000.
However, the cryptocurrency defended $6,300 yesterday amid intraday oversold conditions, establishing the round figure as a key short-term support. But, the resilience failed to entice bulls, rather a long liquidation (unwinding of long BTC trades) gathered pace, creating downside pressure on prices.
Consequently, BTC fell to a low of $6,145 earlier today and was last seen trading at $6,170. Clearly, the risk of a drop below $6,000 has increased substantially in the last few hours.
It is worth noting that the probability of BTC price charting a bullish inverse head-and-shoulders pattern would drop sharply if the cryptocurrency finds acceptance below $6,000.
Hourly chat
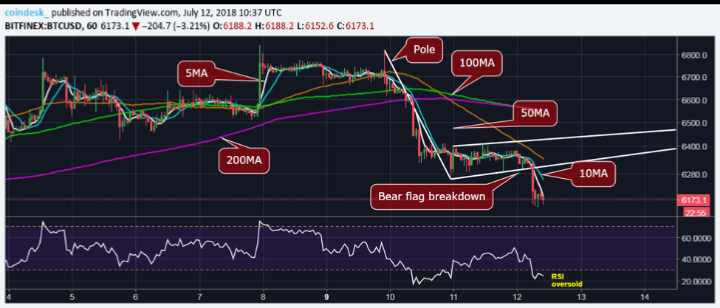
The bear flag breakdown, a bearish continuation pattern, indicates the sell-off from the recent high of $6,820 has resumed and prices could revisit the June 24 low of $5,755 (target as per the measured height method).
The major moving averages (50,100 and 200) are trending south and are located one below the other, signaling the path of least resistance is to the downside. So, a break below $6,000 looks like a done deal.
The only factor that may help BTC stay above $6,000 is the oversold conditions shown by the relative strength index (RSI). That said, the relief could be short-lived as the RSI on the longer duration charts is biased to the bears.
Daily chart
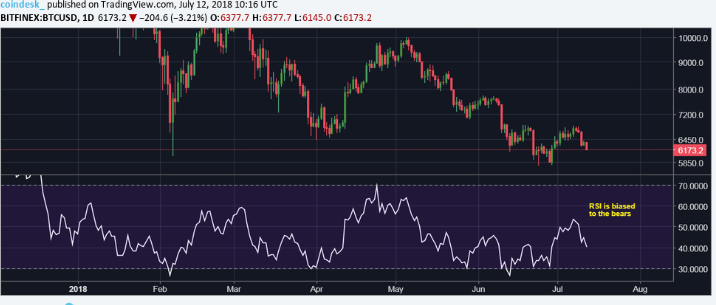
The RSI is hovering below 50.00 (bearish) but is holding well above the oversold region (below 30.00), which means there is plenty room for a drop towards $5,755 (bear flag breakdown target).
Sell-off could ruin a potential inverse head-and-shoulders reversal pattern
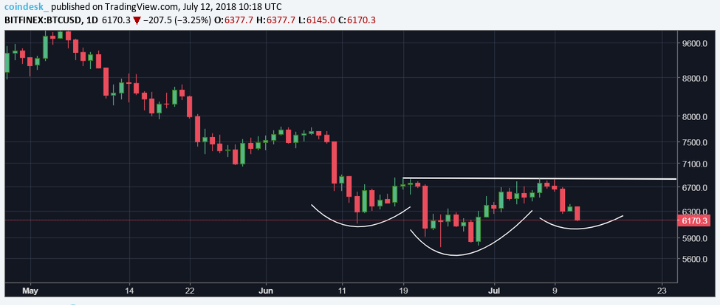
The inverse head-and-shoulders pattern comprises three successive troughs, the middle trough (head) being the lowest and the two outside troughs (shoulders) being low and "roughly equal"
In BTC's case, the left shoulder's low is $6,108. So, BTC needs to create the right shoulder in the range of $6,000-$6,100, i.e. bulls need to defend the support at $6,000 and stage a solid rebound, else the dream of a picture-perfect inverse head-and-shoulders pattern will remain elusive.
Our view
Bitcoin risks falling below $6,000 in the next 24 hours and could extend the decline towards the recent low of $5,755, the hourly chart indicates.
Acceptance below $6,000 would kill the odds of BTC price charting an inverse head-and-shoulders bullish reversal pattern.
On the higher side, only a convincing move above $6,408 (high of the bear flag) would abort the bearish view put forward by the bear flag breakdown.
What your view of BTC price in coming future ??
If you have questions regarding this than ask ..
If you like analysis than upvote & comment , you must should follow me .
Image source - shutterstock & coindesk.
Thank you
Awadhesh kr
( Financial advisor )
Hi! I am a robot. I just upvoted you! I found similar content that readers might be interested in:
https://cryptonews.com.au/story/bitcoin-bull-move-on-hold-as-downside-risks-grow-36309