$XMR/BTC Technical Analysis Nov. 29, 2016.
Hello Steemers!

Sharing my Monero chart with you. @holabebe has asked if i could do one on so here we go.
Monero has undergone a hard pump, making a new all time high on 0.0265 BTC, the market has allot of volume and is actively traded.
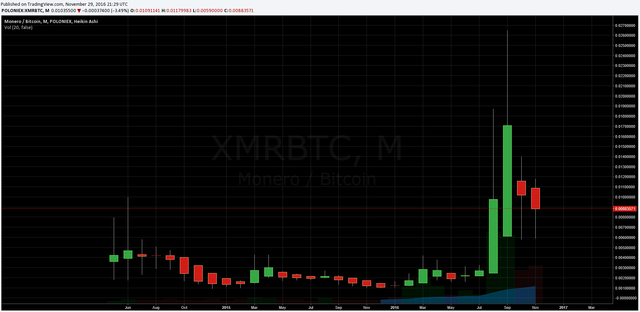
1 month chart Poloniex -clean - Nov. 29, 2016
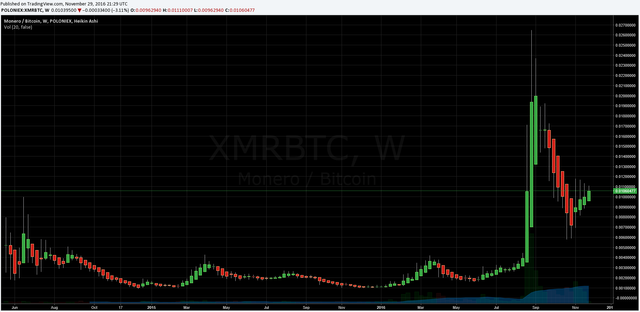
1 week chart Poloniex -clean - Nov. 29, 2016
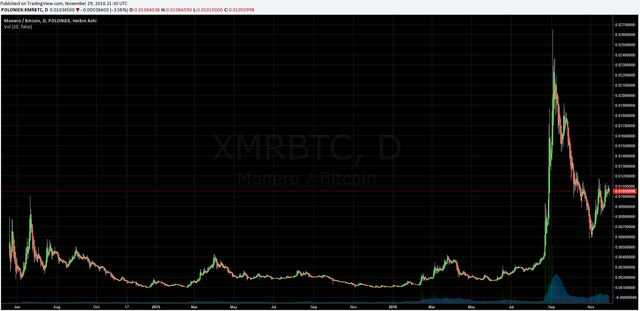
1 day chart Poloniex -clean - Nov. 29, 2016
Since the pump to the new all time high of 0.0265 the price has been trending downwards to a new local low of 0.0058 with some bounces along the way. After hitting the local low it made a bounce reaching to 0.0118
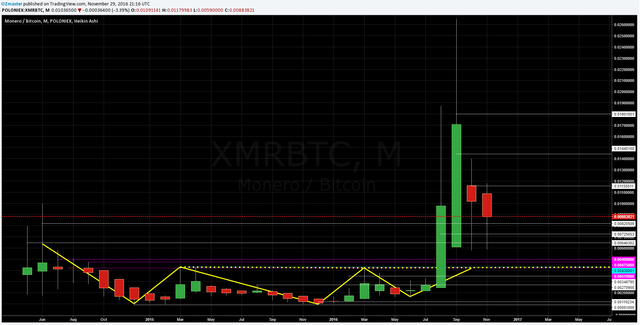
1 month chart Poloniex -lines - Nov. 29, 2016
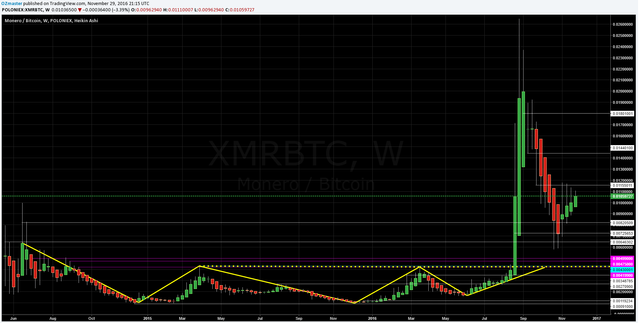
1 week chart Poloniex -lines - Nov. 29, 2016
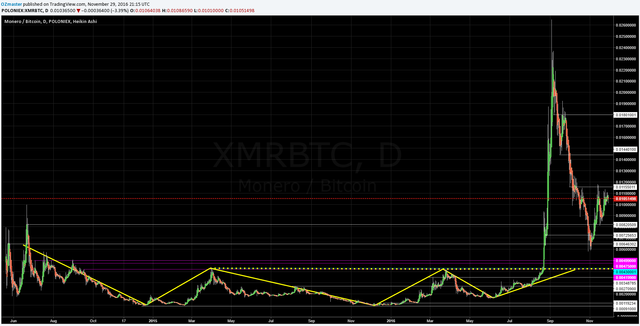
1 day chart Poloniex -lines - Nov. 29, 2016
Added some lines I see as historically important. After adding those on the daily chart we can see how the price used previous
high levels for bounces and stopping points.
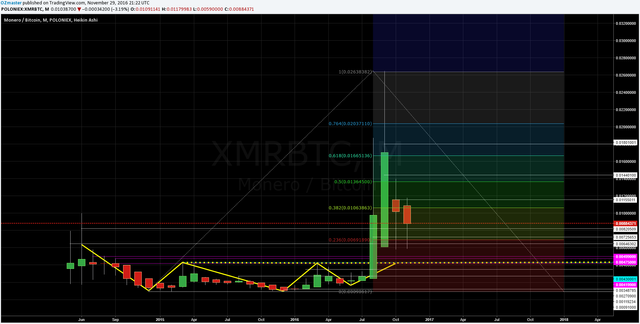
1 month chart Poloniex -fib - Nov. 29, 2016
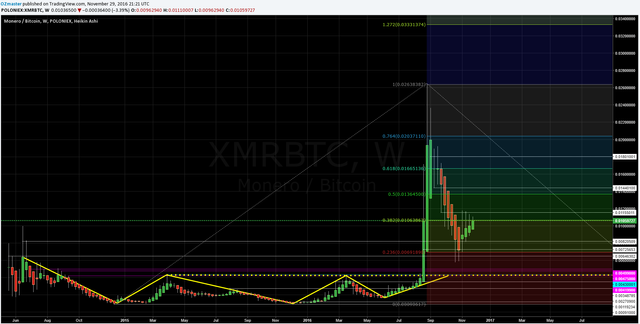
1 week chart Poloniex -fib - Nov. 29, 2016
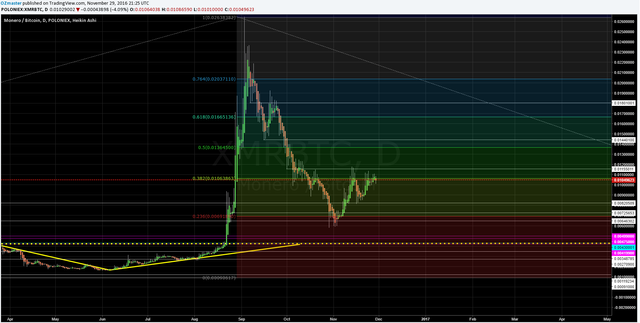
1 day chart Poloniex -fib - Nov. 29, 2016
With the fib added the 0.007 and bellow levels seem to be where the heavy support is and some possible targets on the upside.
What to expect next?
The price already made a nice swing and hit one of the resistance levels, I see 3 possible scenarios playing out in the next few weeks:
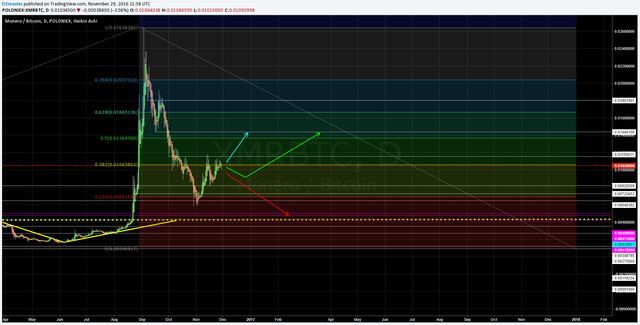
blue.) the bounce goes on and directly hits about 0.0144+
green.) short pullback before the price charges for another local high at 0.0144+
red.) downtrend goes on and the price attacks the ~0.004 support levels
COMMENT
Once again, I will post the comment by commenting as it involves my personal opinion!
Thank you for understanding!
If anyone has any questions or need's help fell free to ask, I will try to explain as fast and as best as I can.
Critics, comments, reply's, counters, advice's, etc. are always welcome!
Have my charts helped you in any way?Let me know with a comment below :)
Are there more people who are doing TA?
Please post the links to your TA's posts into the comments as well!
DISCLAIMER
I am showing multiple scenarios on the price movement, in the post itself I do not take any stance, either bullish or bearish. I am not responsible for neither you’re winning nor you're losses upon trading! the "comment" section is my personal opinion and does not mean I have to or do hold any positions in the given market.
Everyone who uses TA develops his own unique charting style, please keep that in mind.
Kind Regards, OZ :)
COMMENT
Since the market is pretty active and the volume quite high, I'd go for either the green or the blue scenario, I think it's too early for the price to do down to the 0.004 support levels, thinking the price will want to move around and use the newly generated low's and highs before going down to the 0.004 support levels.
Some serious changes are happening out there, thanks for sharing! Namaste :)
Have you been tracking your own forecasting results? Doing so while documenting a handful of specific criteria you've been them on could help fine tune over time.
yeap, thanks to steemit i'm forced to do it :) keeps a pretty good record and helps with the historical view and is good for learning!
Good point! Now if you can figure an interesting way to consolidate your predictions into a database with some key variables we can get to work :)
what u mean?
well on one side you have the accuracy of your predictions, and on the other you'd need key variables that induced you to make those predictions. Then the analysis can get fun and you can continuously improve your performance. Just a thought...
Your charts look better than most. Well done. 👍
thanks you :)