Still Grasping For A Swing Low; Looking For End To This First Leg Down
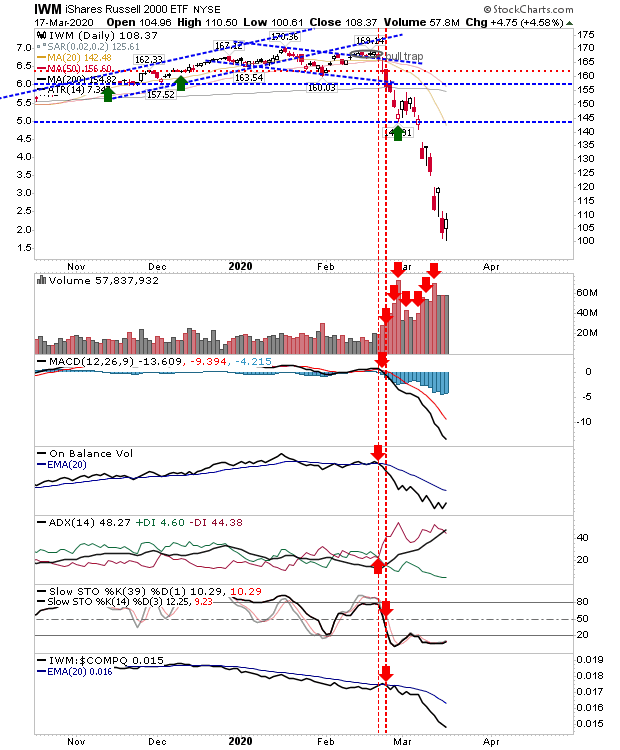
Markets continued their downward leg on Tuesday, in an attempt to an establish a low. For example, the Russell 2000 has already given up 35% from its highs and yesterday's candlestick didn't suggest a capitulation (it looked better on Friday). For many of the indices there are no developing divergences to work with and there hasn't been any semblance of a bounce to establish a sideways consolidation of losses, so we are still looking for a swing low to work off.
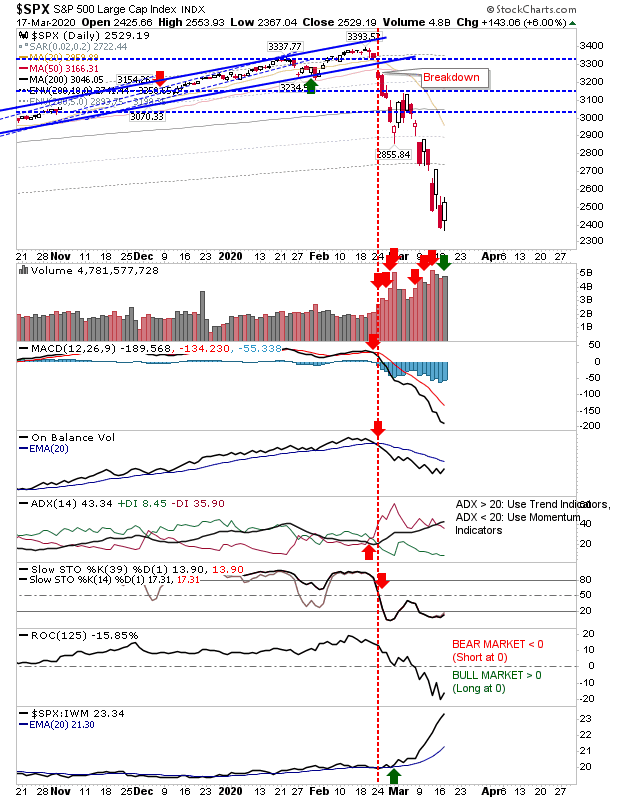
The S&P did register as an accumulation day and managed a reversal of Monday's losses, but aside from that there wasn't much more to say. The S&P has comfortably surpassed the 5% zone of historic weak action, but to hit the 1% zone would require a tag of 2,223.
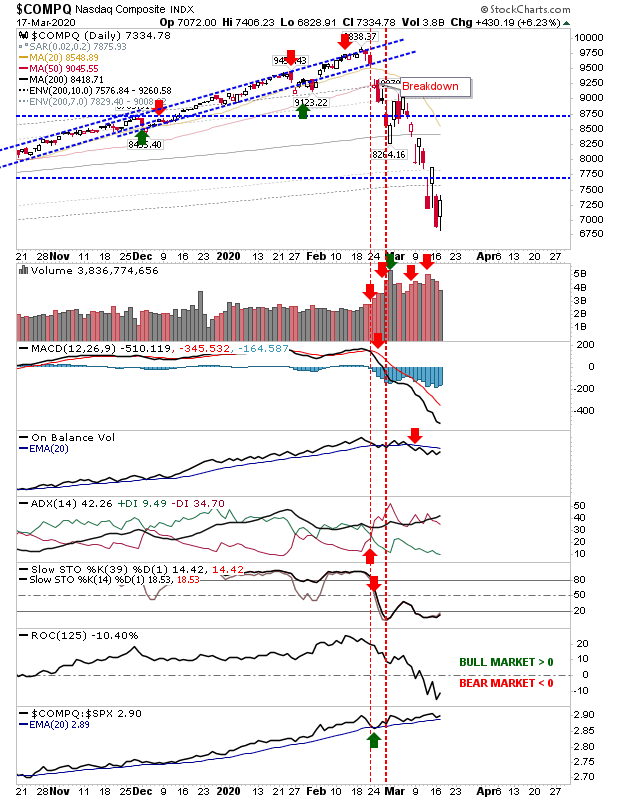
The NASDAQ didn't enjoy the same level of accumulation at the S&P and volume was down on Monday's trade—although last Thursday's volume was a far greater capitulation than volume which followed. This could be a good sign that a bottom is already in place, and current trading is an oversell from this.
The Russell 2000 (via i
Shares Russell 2000 ETF (NYSE:IWM)) is another index which has seen trading volume fall since last Thursday. It's also the index which has been hardest hit by sellers and is well inside the 1% zone of historic weak action. However, we still await a bullish divergence from supporting indicators.
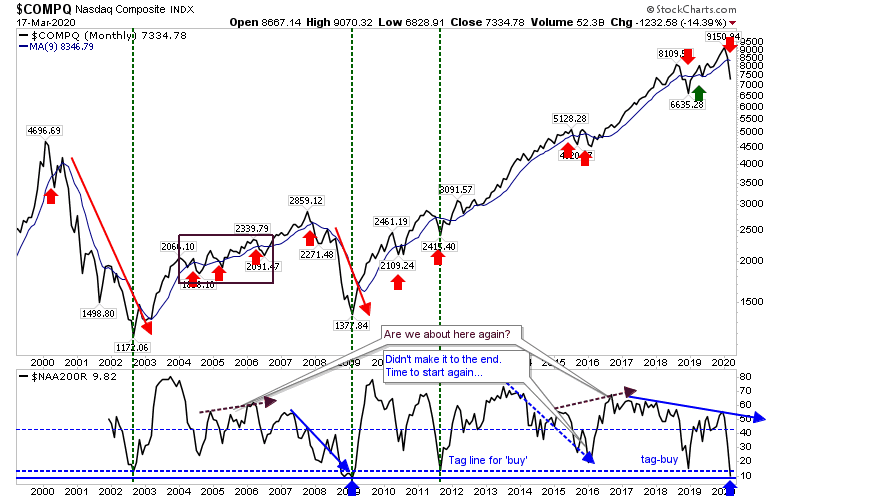
Speaking of the NASDAQ, the Percentage of NASDAQ Stocks above the 200-day MA has now tagged a level last seen in March 2009. Again, it may not feel like a 'buy' trigger but the NASDAQ has reached a point where buying a little may be better than doing nothing at all.
Going forward, we want to see some stability from the indices so that a low can be established. But until then, we are still looking for an end to this first leg down. Investors needn't worry as spreading an investment over time will allow one to dollar-cost-average, but traders need to wait for some lower volatility to establish the risk:reward play.