After Market Rout, Now What? Strategies For Dow, VIX, Silver
Dow analysis and strategy:
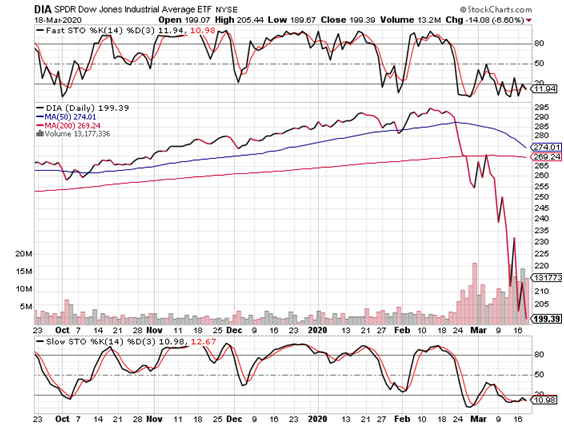
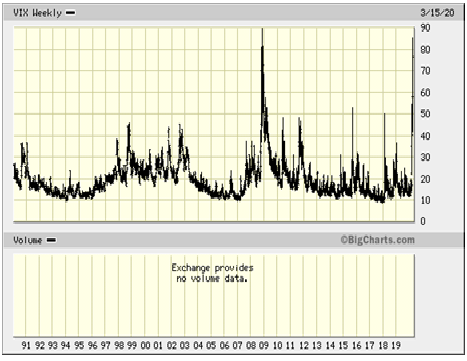
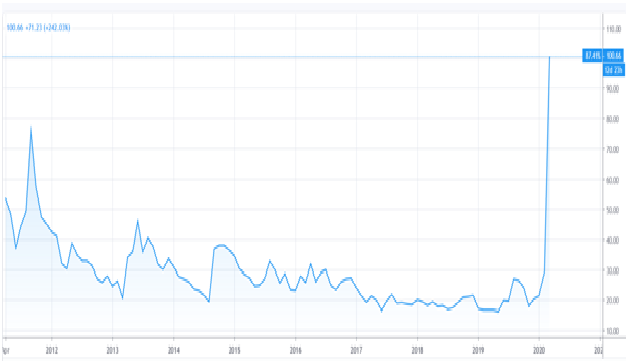
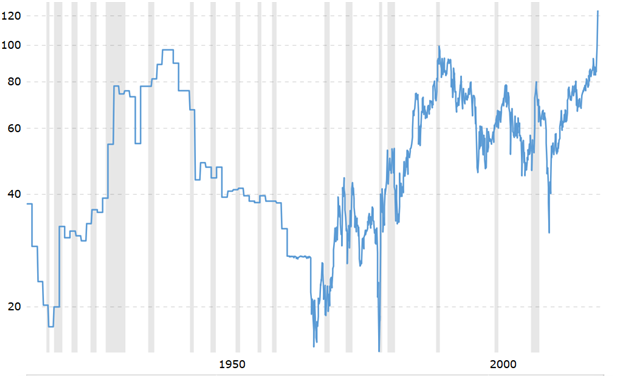
There are two key observations that I may make based on this section’s two graphs, the 6-month Dow chart and the 30-year VIX:
Firstly, a confirmed stochastic buy signal would be triggered by a cross over the 20-level, which would likely be caused by a positive close on Thursday (the slow stochastic appears beneath the Dow’s price chart). Here, I am simply reporting facts as opposed to forecasting.
Secondly, for those familiar with Elliott, wave-4 resistance is ~21,000. Based on this, different strategic possibilities exist according to one’s situation.
These pages have been devoted to market timing and advising on the management of the related put option combination program, engineered to provide income and protection against significant declines.
After several reports (dating back to August 2019) which advised owning this combination, the March 11 report went into greater detail regarding the engineering of such a strategy.
The report also explained that my own selected VIX level for reentry into the strategy after the closing of a profitable trade is 27.5. Therefore, since the VIX is nowhere near any break below 30, and since I believe that the Dow is not going to bottom until it is somewhat closer to the 15,500 zone (longer term chart will be included next time), an already-closed second position of the year would not be reestablished to create a third, if it has indeed already been closed.
It is understandable that one would have wished to protect dramatic profits, given abounding losses for most investors and the wish to offset other portfolio losses with any dramatic triple-digit gains stemming from the combination’s hedge.
There is the issue of the exact engineering of the put combination at which one would have arrived, which includes the rule for the downside trigger (rules-based liquidation).
Also, much of whether or not one would have closed a second extremely profitable trade of the year would depend on one’s management of the engineered program.
The downside trigger would have been hit according to any reasonably structured put combination program (including mine), but experience would have suggested to some that a mushrooming VIX is a rare opportunity to balloon one’s profits. There are multiple ways of doing this, of course.
Personally, I view simple liquidation as doing the market a favour, but these pages cannot refer to unseen actions to determine an exact level of success, whether it is of the income and protection hedging program, or anything else, for that matter.
For instance, if one’s trigger had been hit, but one wished to take advantage of a VIX chart that had/has completely broken out, one could (have) always sold nearer term at-the-money puts to run-up the score. In such a situation one wins either way, and this kind of active management (which also hedges gains-to-date) is actually quite obvious under such circumstances. Such situations are like being on a trader’s beach when it is all easy.
In any event, if one is sitting on sizeable gains in 2020 without an existent position and wishes to reenter the short side as a trader using profits, one could do so with something like a bearish reverse diagonal call spread; this attempts to sidestep the negative effects of an extreme VIX level.
An example would be buying the June 30 SPDR® Dow Jones Industrial Average ETF Trust (NYSE:DIA) or DJX at-the-money calls, while selling the April 17 175 calls. This opens up multiple money-making opportunities resulting from the respective time premiums and the multiple expiry dates that one can short after the April 17 expiry, whether that option expires worthless or not. Beware of factors to be considered when comparing European versus U.S.-style contracts.
Except for silver, I will not follow-up on short term trading ideas, because my sole interest in the indices has been, and is, the income and protection put combination strategy, which is designed to provide positive returns after a bullish quarter, as well as dramatic triple-digit profits after a bear market-style quarterly decline of 8–10%.
Of course, I remain devoted to commentary regarding the best management of such a position within the context of real-time market forecasts. Regarding the latter or the contemplated bearish reverse diagonal call spread, a near-term shorting point is about 1,000 points above yesterday’s market close.
The VIX chart below shows that it is in spitting distance of its all-time high at 90 at the end of 2008. Also note that the market only bottomed 3 months later as put premiums are predictive (lead the market).
Silver and Gold analysis and strategy:
March 11, 2020 pre-opening report:
“I explained the counterintuitive form of such analytic interpretation so that one not be shaken out of long term gold positions by sharp declines, such as the $40-60 smash that I expect in the near term; most of that smash could even occur tomorrow (Wednesday March 11).”
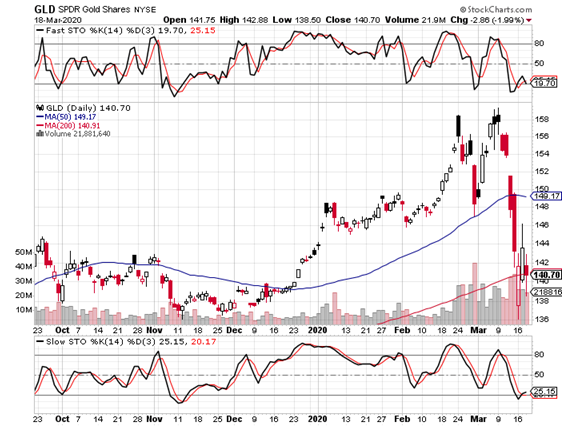
Based on the 6-month SPDR® Gold Shares Fund (NYSE:GLD) chart immediately below, the stochastic is oversold and turning up, as the March 11 wrote should occur by Wednesday. Gold HAS CORRECTED WITHIN AN UPTREND, has fallen to major support (which is more optically pronounced on charts of longer duration than the one below), and has very quickly snapped back above its 200-day moving average.
MASSIVE support exists at ~137 so one should go long but, based on this section’s first paragraph, one should already be invested at 148.
A 10,000-point collapse in the Dow in 2020? Check.
Gold correcting within up-trends? To the trained eye, check.
Silver up $10.00 from bottom-to-top? It’s much more likely to occur if counting from recent lows, mathematically-speaking but, as we know, the December and January reports meant from 2019’s low, just as I had been referring to the Dow’s 2019 peak.
In this market, yes, silver could be off 2019’s low by $10! Would a ~130% blast-off through to yearend really be more unusual than what we’ve already seen in 2020?
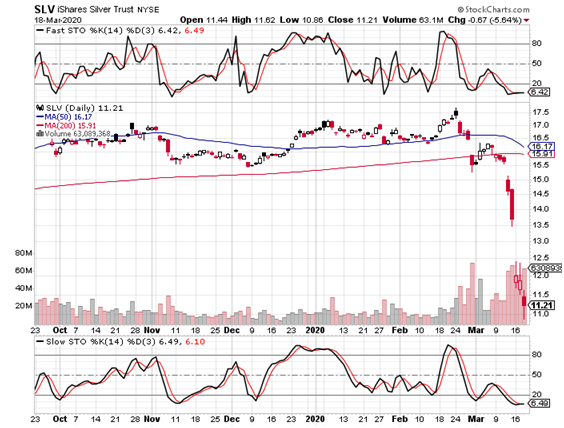
The 6-month i
Shares Silver Trust (NYSE:SLV) chart follows below.
Here are a few observations based on this chart, and resulting as well from the 2nd and 3rd charts below, the VXSLV (SLV option time premium index), which dates back to the April of 2011 peak, and the 100-year gold:silver ratio.
All taken together, one can see that the SLV could rally to $13.5 and it wouldn’t even mean anything. While those charts are not shown here, note how the Van
Eck Vectors Gold Miners ETF (NYSE:GDX) and Van
Eck Vectors Junior Gold Miners ETF (NYSE:GDXJ) (the miners’ indices) fell 50% within weeks, before rallying 60 and 70%, respectively, from this week’s lows (and during a collapsing stock market)! Madness.
The VXSLV has FLOWN ABOVE ITS 2011 PEAK, when the SLV almost hit $50. That year, gold crossed $1,900, thereby breaking its $800+ peak in 1980. In 1980 and 2011, silver hit up around, but no higher than $50.
As well, in 2008, gold bottomed at $681 while silver bottomed at $8.40. This is yet another way of gaining some perspective regarding the magnitude of how high the crowd can drive silver prices from here. 130%?
Though on a slightly different point, these metals were somewhat higher by the time that stocks bottomed in March 2009, almost 6 months after the PM lows.
Before concluding with a trading strategy, the closing note relates to this report’s 2nd-to-last chart (VXSLV).
Given its own breakout to new all-time highs, coupled with the ratio chart, the upside is outrageous. On Tuesday, though the SLV was slightly lower, both puts and calls were higher. In 38 years, I have never seen that before.
Though I was confident of a low in silver a few dollars higher than here, I do strongly suspect that we have finally seen the bottom and that there will be no divergence over the coming weeks (no new lows). It would be unusual, though not as ridiculous as what we have been seeing, to take-off without a divergent buy signal, but, as this report writes, everything is weird today.
Imagine that a call spread I recently purchased is actually up a few pennies, despite a multi-dollar decline. To say that volatility premiums have supported call prices despite a bashing in the metal is an understatement.
If one were so inclined, one could consider purchasing a September 30/June 30 $15 call spread. The closing bid-ask was 36-47 cents, with a mid-point of $0.415.
Without considering anything other than the above, one may contemplate a market-opening bid of 44 cents.
If the June cycle causes the short put to expire, one would possess a great deal of leverage. Otherwise, one may view the cost base (44 cents) as relatively easy to recover (see above regarding the PMs’ respective lows in 2008).
Remember, a time spread such as this greatly mitigates the negative effects of going long at extremely high VXSLV levels, particularly given the reasonableness of the strike price.
Join the community in our migration to Hive, a community built blockchain for the community. All Steem account holders will receive equivalent stake on the new Hive blockchain.
Please see this post on SteemPeak for more information.