Gold Tentative Short
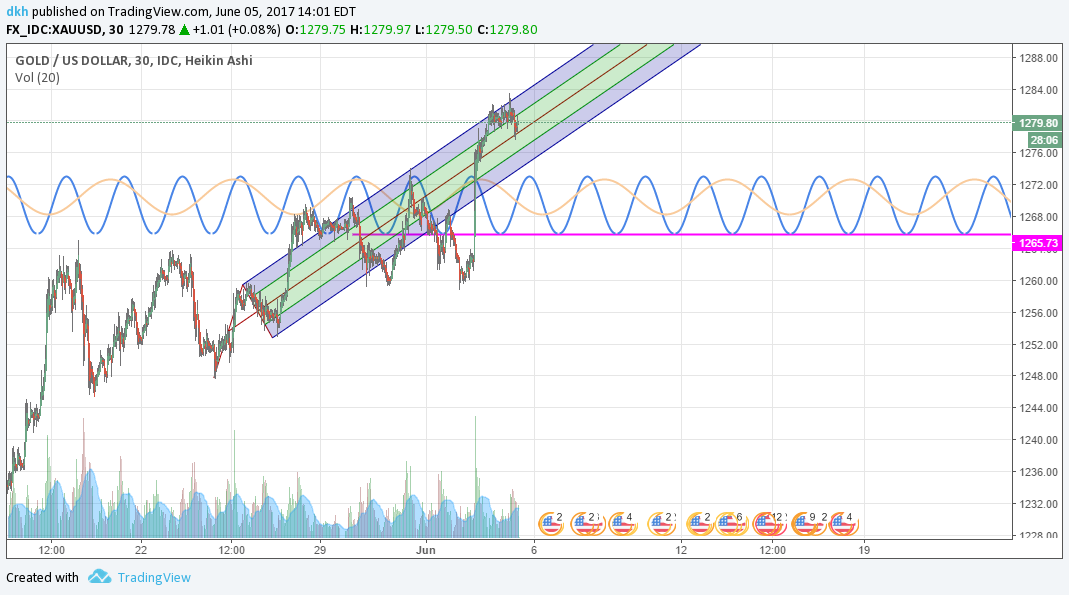
You can see in this chart we use a daily timeframe on the top and 15-minute timeframe on the bottom. This is typically how I Iay out my trend charts. In this case we see a possible breakout on the daily chart of gold however I currently believe this is a fakeout. I think the major trendline resistance shown in the part will push us violently back down.
Since the 15min is approaching resistance from the downside, this presents a potential short opportunity in the shorter timeframe. I will take a small speculative short at this nice round 1280 level. Our first target would be 1270, then 1255. Cheers!
I concur
Thanks. Amazing how well your sine cross worked at predicting the big upmove last week. Cheers!
we need soph to do the channel work and Amp to do the zone work. If we charted the same thing in all 4 ways we would likely have a strong set
Its Broken DECISIVELY Above Your ENTRY Frankly 1 & 2 Diagonals DONT Tell U Much thats WHY I apply #MULTIDIAGONALS to Get the WHOLE Picture