Market Turmoil Continues As Central Banks Fail To Ease Panic
Major EU and US indices tumbled yesterday, despite the further easing by the RBNZ, the Fed and the Bo
J. It seems that the bold actions by the former two Banks raised concerns that central banks are spending too much ammunition too early. On top of that, it seems that the restrictive measures worldwide have done very little to contain the spreading of the virus, with investors still biting their nails over whether and when all this will end.
EQUITIES’ BLOODBATH RESUMED YESTERDAY, EVEN AFTER BOLD CENTRAL BANK ACTIONS
The dollar traded higher against most of the other G10 currencies on Monday and during the Asian morning Tuesday. It gained the most versus AUD, CAD, and GBP in that order, while it underperformed versus EUR and CHF. The greenback was found virtually unchanged against JPY.
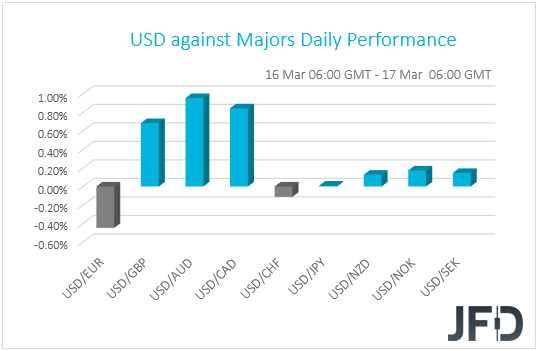
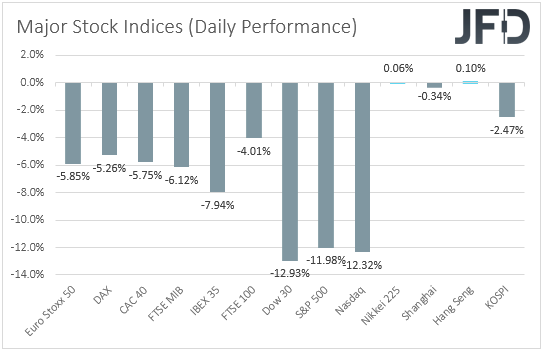
The relative strength of the euro, the yen and the franc, combined with the weakening or the risk-linked AUD and NZD, as well as the oil-related CAD and NOK, suggests that markets traded in risk-off mode for another day. Indeed, most major EU indices slid more than 5%, with the tumble accelerating during the US session. All three of Wall Street indices fell around 12%, recording its biggest drop since the “Black Monday” of 1987. That said, panic eased somewhat during the Asian morning today, with Japan’s Nikkei 225 closing virtually unchanged and China’s Shanghai Composite losing only 0.34%.
During the early Asian morning Monday, three major central banks decided to ease their respective policies further, outside scheduled meetings, in an attempt to safeguard the global economy from the negative effects of the fast-spreading coronavirus. The chorus started with the RBNZ, which cut its benchmark rate by 75bps to +0.25%. The FOMC was next with an even bolder action. US policymakers decided to reduce the Federal funds rate target by 100bps, to 0-0.25%, and noted that they will start purchasing a broader range of US Treasuries, which means a new round of QE. Later in the Asian session, the Bo
J, although it did not cut rates, pledged to double the pace of its ETF purchases.
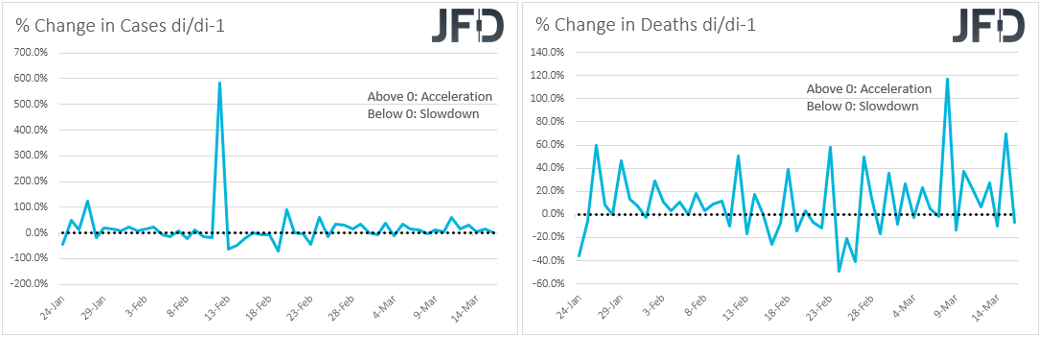
However, the decisions had no success in calming panicked investors. On the contrary, market participants got even more worried as central banks may have spent too much ammunition too early, and that they will have limited scope for supporting battered economies in the not-too-distant future. On top of that, it seems that the restrictive measures worldwide have done very little to contain the spreading of the virus. Although both infected cases and deaths have slowed somewhat yesterday, most days have been marked by acceleration. Sentiment was somewhat improved during the Asian session, perhaps on hopes that governments will join the rescue mission by aggressive fiscal spending. G7 finance ministers may hold a call tonight, something that raised speculation they may coordinate a fiscal response.
In any case, our view has yet to change. We don’t believe that monetary and fiscal stimulus will be enough to save the global economic outlook. With the virus still spreading fast and with no vaccine on the horizon, lower rates are unlikely to prompt consumers and businesses to start opting for cheap loans and start spending. In a still chaotic situation, more restrictive measures may be in the works, which could well weigh further on the global economic outlook. Bearing in mind all this uncertainty, it would be naïve to assume that everything is already priced in. Therefore, we stick to our guns that there is still room for equities and other risk-linked assets to continue tumbling, while safe-havens may keep attracting flows.
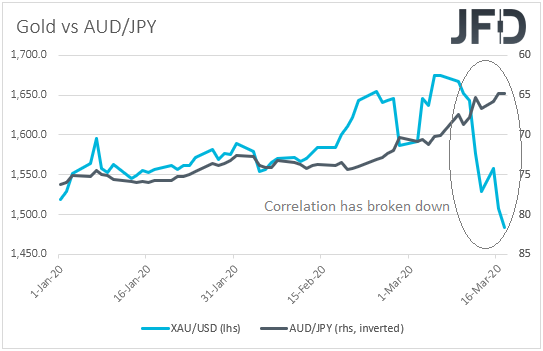
The exception in this pattern appears to be gold and other precious metals. It seems that gold took off its safe-haven suit, tumbling more than 3% yesterday. Why is that? In a leveraged world, holders of long positions in the yellow metal may have liquidated their positions in order to cover losses and margin calls elsewhere.
In the FX world, we repeat that the best gauges of such market conditions are combinations of a risk-linked currency and a safe haven. For example, AUD/JPY, AUD/CHF, NZD/JPY and NZD/CHF may be the pairs to continue sliding the most. On the other hand, EUR/AUD and EUR/NZD may prove to be the main gainers.
AUD/JPY – TECHNICAL OUTLOOK
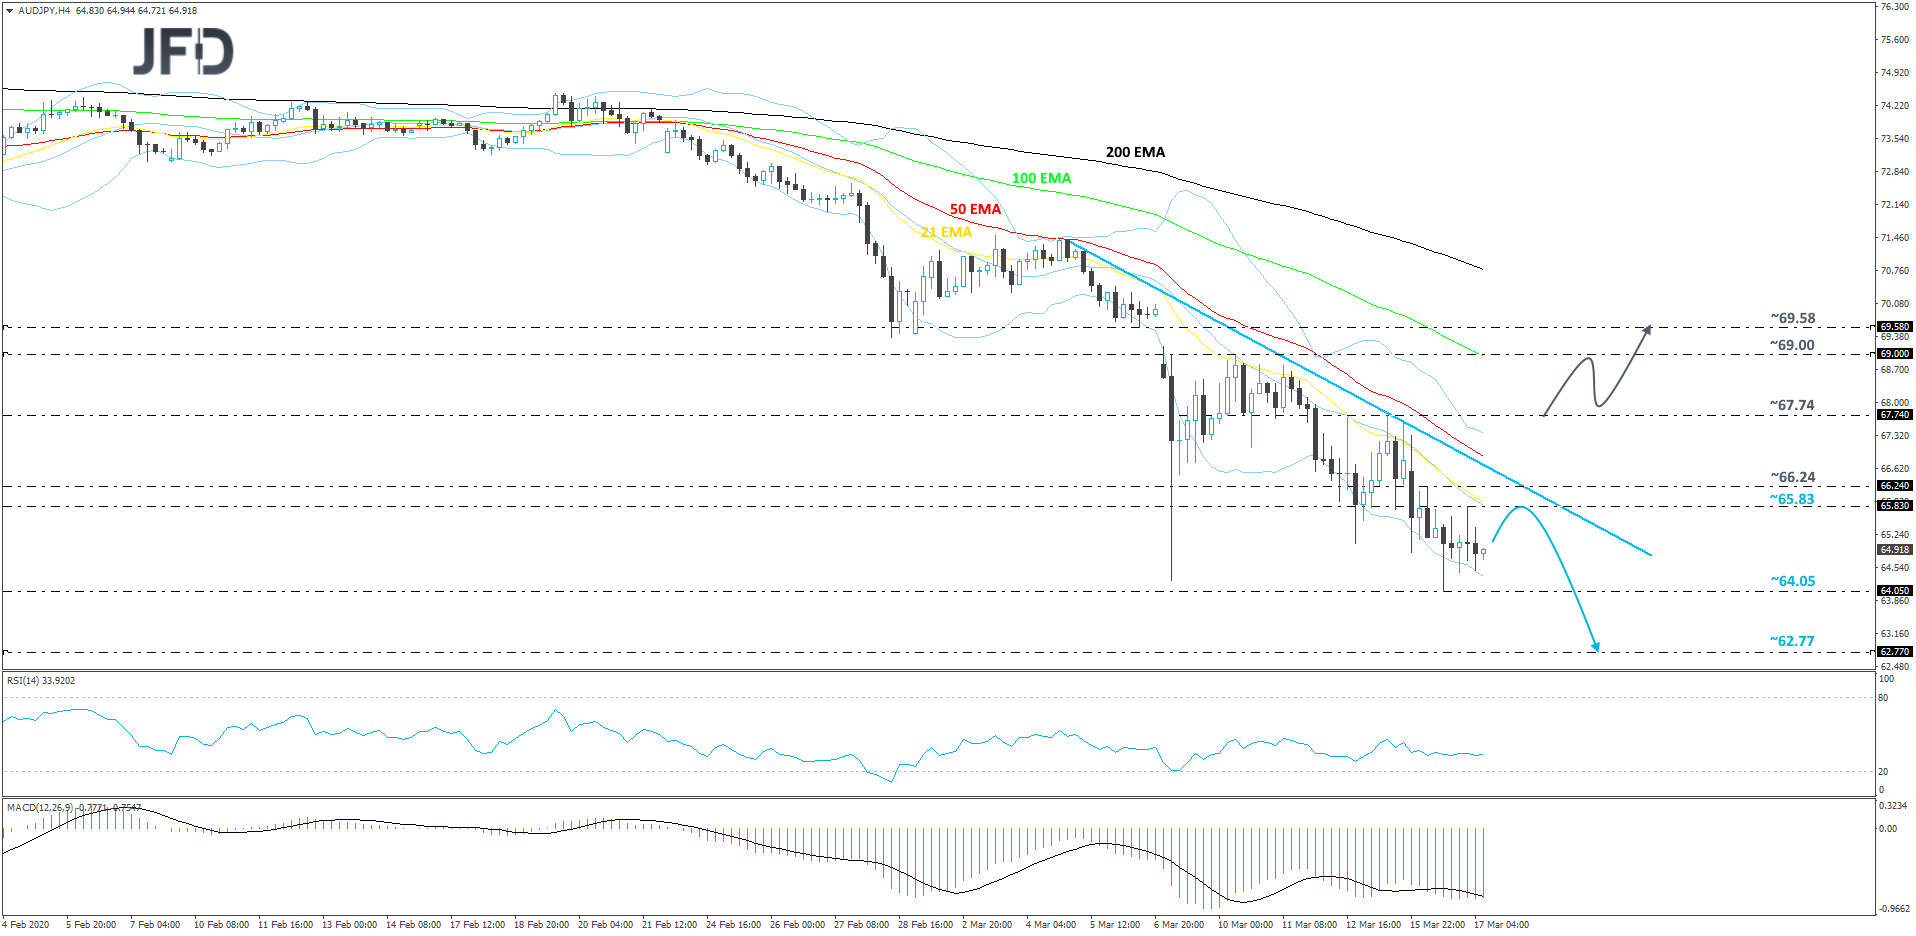
AUD/JPY continues to move lower, as the markets are feeling the heat and investors are seeking safe havens, such as the Japanese yen. The pair is still trading below a short-term downside resistance line taken from the high of March 5th. Yesterday, the rate made a new March low, hitting the 64.05 hurdle and then rebounding slightly. Even if we see a move higher in the near term, that could still be classed as a temporary correction before another leg of selling, especially if AUD/JPY remains below the above-mentioned downside line.
As discussed above, there is a possibility to see a small correction higher, given the prolonged slide. That said, if the rate stays below today’s high, at 65.83, or the aforementioned downside resistance line, this may drag the pair back down, as the sellers could step in and take advantage of the slightly-higher rate. We will then aim for the current low of March, at 64.05, which if broken may send the pair further south, this way confirming a forthcoming lower low. The next support area could be seen around the 62.77 level, marked by the low of March 11th, 2009.
Alternatively, if the pair pushes above the previously-discussed downside line and climbs above the 67.74 barrier, marked by the high of March 13th, this could attract even more buyers into the game, possibly opening the door to some higher areas. The next resistance zone to consider could be near the high of March 10th, at 69.00. Slightly above it lies another resistance level which could be met and that’s the 69.58 level, marked by the low of March 6th.
NZD/CHF – TECHNICAL OUTLOOK
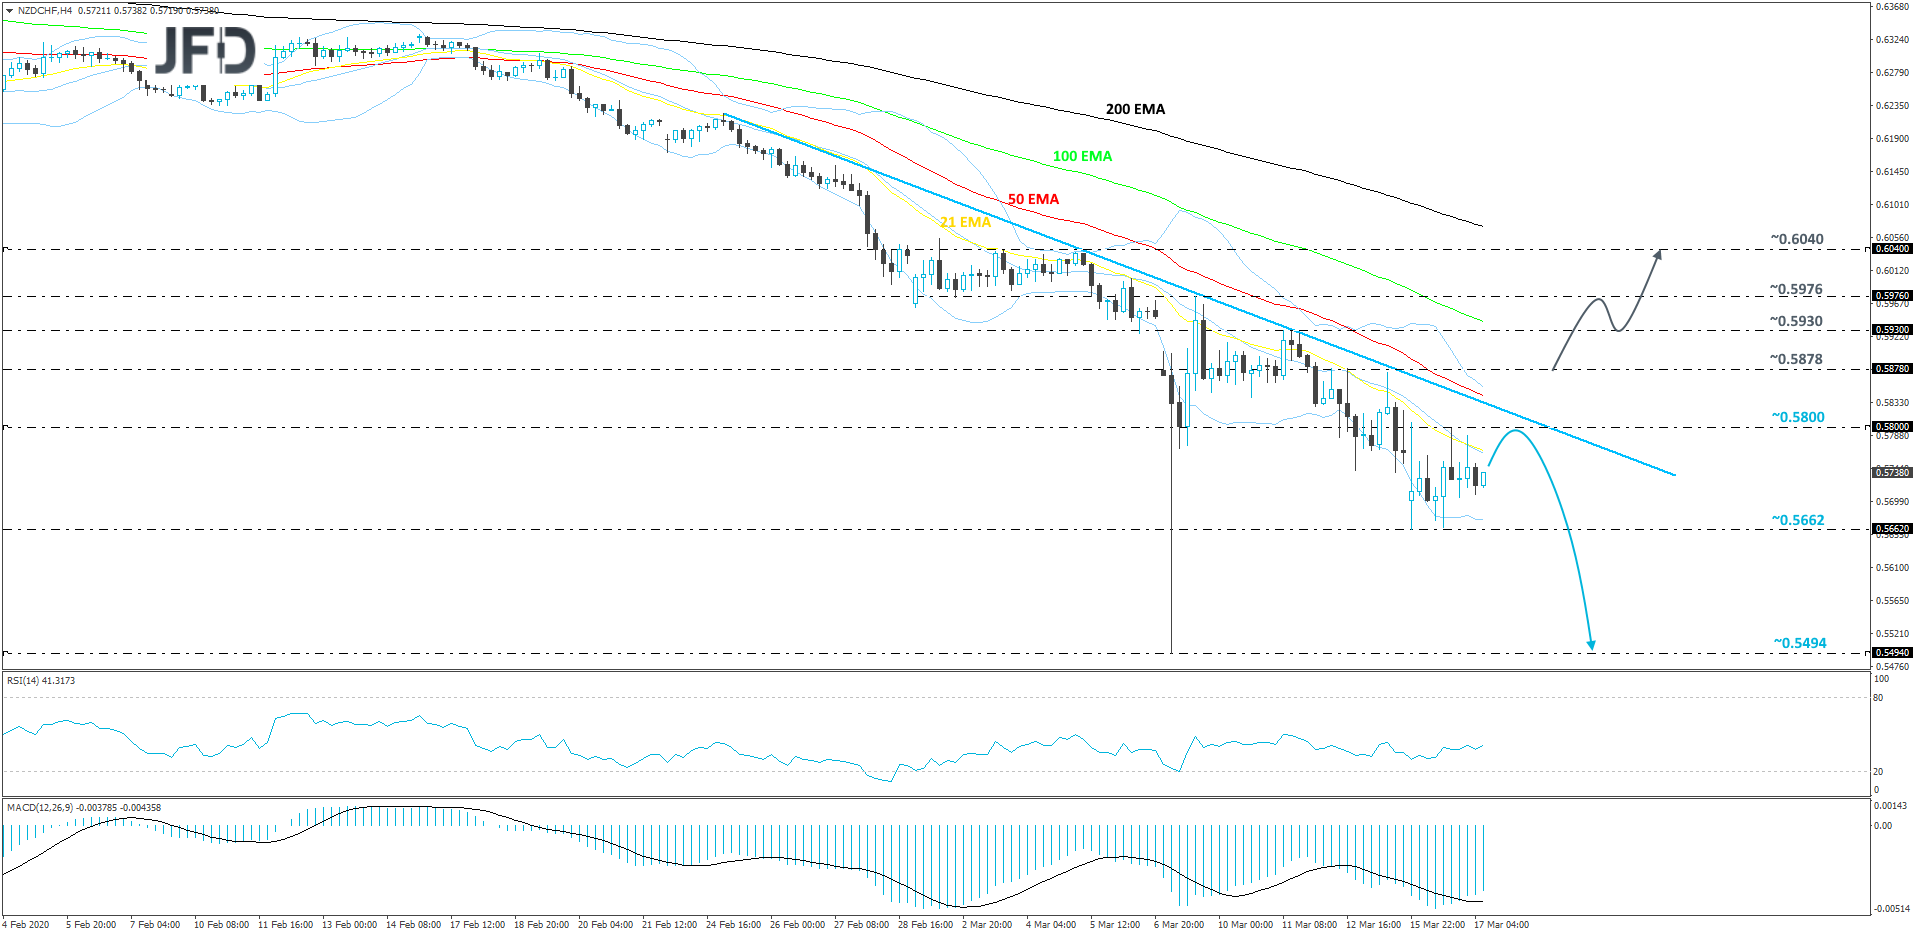
NZD/CHF is still trading near its historic lows, while balancing below a short-term downside resistance line drawn from the high of February 25th. After last week’s sharp decline, where the pair tested the 0.5494 level, it managed to rebound and is now balancing above a key area of support, at 0.5662. Given that NZD/CHF is already quite overstretched to the downside, we may see another small correction before the next leg of selling, hence why we will take a cautiously-bearish approach for now.
A small push higher could bring the rate closer to the 0.5800 barrier, marked by yesterday’s high, or it could test the aforementioned downside line. If that line remains intact, the bears could take the driver’s seat again and drive NZD/CHF towards the 0.5662 hurdle, which continues to act as a strong support zone, so far this week. However, if that obstacle breaks, this would confirm a forthcoming lower low and may clear the path towards the lowest point of last week, at 0.5494.
On the other hand, if the aforementioned downside line breaks and the rate makes its way above the 0.5878 barrier, which is the high of March 12th, that could attract a few more buyers into the game. The pair might then drift to the 0.5930 obstacle, a break of which may send NZD/CHF to the 0.5976 zone, marked by the high of March 9th. Initially, the rate could get a hold-up around there, or even correct back down a bit. However, if the pair continues to float above that downside line, this may result in another round of buying. If this time NZD/CHF moves all the way back to the 0.5930 area and breaks it, that could put the 0.6040 level back on the radar, as the next potential resistance barrier.
AS FOR THE REST OF TODAY’S EVENTS
During the European morning, we have the UK employment data for January. The unemployment rate is expected to have remained unchanged at 3.8%, while average weekly earnings including bonuses are forecast to have accelerated to +3.0% yoy from +2.9%. The excluding bonuses rate is anticipated to have remained unchanged at +3.2%. We don’t believe that this set of data will prove so determinant with regards to the Bo
E’s future course of action, as they refer to a period before the fast spreading of the coronavirus around the globe.
Last Wednesday, the Bo
E decided to cut interest rates by 50bps, outside a scheduled gathering, while the UK Chancellor of the Exchequer Rishi Sunak announced that the nation will borrow almost GBP 100bn more in coming years than predicted a few months ago. In our view, the large fiscal loosening lessens the need for the Bo
E to proceed for more rate cuts, and with other major central banks expected to continue easing, this may allow the pound to rebound, at least against the likes of AUD, NZD and CAD.
From Germany, we get the ZEW survey for March. The current conditions index is expected to have slid further into the negative territory, to -30.0 from -15.7. This would mark the 8th straight month with a negative sign. The economic sentiment index is also expected to tumble into negative waters, to -29.0 from 8.7. With the coronavirus spreading in the EU at a fast pace, a slump in those indices appears more than normal to us. From the Eurozone as a whole, we get the Labor cost index and wages for Q4. The Labor cost index is forecast to have accelerated to +3.0% yoy from +2.6% in Q3, while no forecast is currently available for the wages rate.
In the US, we have retail sales, industrial and manufacturing production data, all for February. Both headline and core sales are expected to have slowed to +0.2% mom from +0.3%, while the industrial and manufacturing production rates are forecast to have returned into positive territory. Namely, the IP rate is expected to have risen to +0.4% mom from -0.3%, while the MP one is forecast to have increased to +0.3% mom from -0.1%. The JOLTs Job Openings for January are also coming out and the forecast points to a small decline.
With regards to the energy market, the API (American Petroleum Institute) weekly report on crude oil inventories is coming out, but as it is always the case, no forecast is available.
As for tonight, during the early Asian morning Wednesday, New Zealand’s current account balance for Q4 is coming out and the forecast points to a narrowing deficit. Japan’s trade data are also due to be released with the nation’s deficit expected to have turned into surplus.
We also have one speaker during the Asian session, and this is RBA Assistant Governor Luci Ellis.
Daily Market Review: Market Turmoil Continues as Central Banks Fail to Ease Panic
Warning! This user is on our black list, likely as a known plagiarist, spammer or ID thief. Please be cautious with this post!
If you believe this is an error, please chat with us in the #appeals channel in our discord.