Markets Calm Somewhat On More Policy Easing
The financial community calmed somewhat yesterday following further easing measures by more central banks. Oil rebounded on Trump’s hints to intervene and stabilize prices, while the US US Dollar Index retreated after the Fed decided to supply via swaps nine additional nations with dollars.
RISK AVERSION EASES ON ADDITIONAL EFFORTS TO SOFTEN THE VIRUS ECONOMIC IMPACT
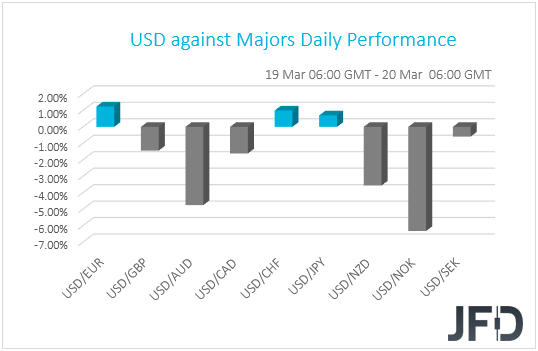
The dollar retreated against all but three of the other G10 currencies on Thursday and during the Asian morning Friday. It lost the most ground against NOK, AUD and NZD in that order, while it eked out some gains versus EUR, CHF and JPY.
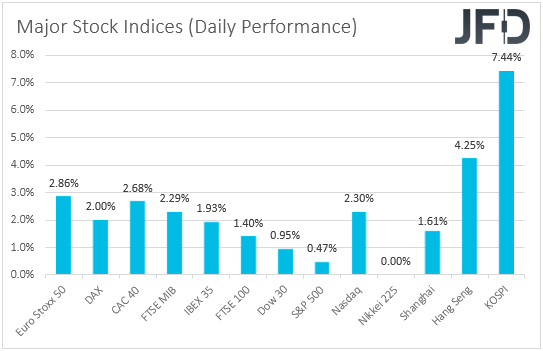
The weakening of the safe havens and the strengthening of the risk-linked currencies suggest that risk aversion eased somewhat yesterday. Indeed, turning our gaze to the equity market, we see that major EU and US indices rebounded somewhat, with the calmness rolling into the Asian session today. China’s Shanghai Composite gained 1.61%, while Hong Kong’s Hang Seng and South Korea’s KOSPI advanced 4.25% and 7.44% respectively. Japanese markets were closed due to the Vernal Equinox holiday.
The relative calmness may have been the result of further easing measures by more central banks, including the Bo
E and the Norges Bank. The Bo
E decided to cut further its benchmark rate, by 15bps to +0.1% and noted that it will increase its holdings of government bonds, which means restarting QE. The Norges Bank also reduced rates, by 50bps to +1.00%, adding that is prepared to make further rate cuts if needed. Officials also said that they stand ready to intervene and lift the Krone, a move not taken in more than 20 years. This comes after the currency’s 30% tumble against the US currency, which was also fueled by the free fall in oil prices. We also had an SNB policy decision, but this Bank refrained from touching its already low interest rate of -0.75%. As we have been expecting, officials just strengthened their intervention language, noting that they will intervene more strongly in the FX market. They also added that the franc is now even more highly valued.
The Swiss franc was among the main losers yesterday, as apart from the broader market calmness, the SNB may have already been stepping up its intervention practices to keep the currency from strengthening further and this is evident by the sharp increases in total sight deposits week by week. Back to Norway and the Krone, this currency was the main gainer despite the 50bps cut by the Norges Bank. It could be due to Norges Bank’s intervention warnings but also due to the rebound in oil prices.
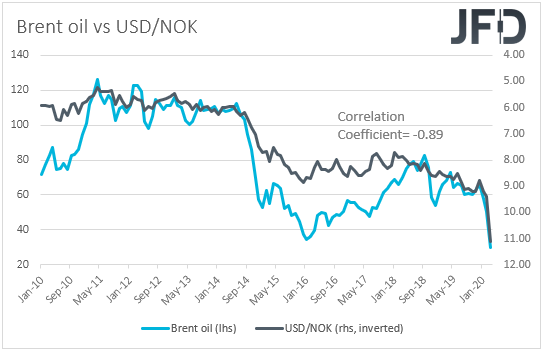
Both Brent and WTI gained 14.43% and 23.81% respectively yesterday, after US President Trump hinted that the US may initiate efforts to support prices at an “appropriate time”. The Trump administration is considering pushing Saudi Arabia to reduce production and to sanction Russia in order to force them do the same. The black liquid may have also been supported by US plans to buy oil for emergency stockpiling. The US’s attempts may keep prices supported for a while, but we doubt that they will be enough to offset the demand shortages due to the outbreak of the coronavirus. Thus, we would treat any further recovery in oil as a corrective move of the broader steep downtrend.
Now, back to the currencies and the US dollar, it’s pullback may have been the result of the Fed’s decision to supply via swaps nine additional nations with dollars. The Fed said that the swaps will allow other central banks to tap up to a total USD 450bn, in order to ensure that the USD-dependent financial system will continue to function.
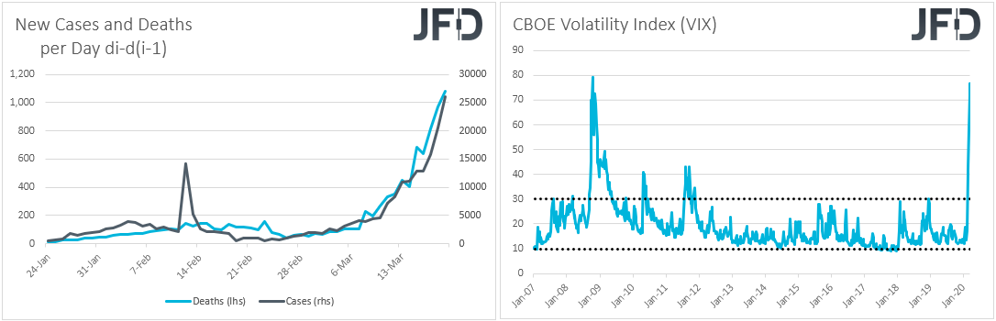
Having said all that though, we stick to our guns that equities may have not hit a bottom yet, and the dollar may have not reached a peak. We repeat for the umpteenth time that the worst may not be behind us yet. The coronavirus continues to spread at an exponential pace, with new deaths and cases hitting new records yesterday. Namely, we had 26111 new infections and 1080 new deaths. We believe that the economic wounds could continue to deepen and that investors may soon abandon risk assets again in favor of safe havens, and even more in favor of the US dollar, which appears to be the refuge in extremely turbulence market conditions. With the CBOE volatility index (the VIX, or “fear index”) hovering around the 2008 crisis peak, no one can doubt that the phase we are going through is a turbulent one. In order to change our view, we would like to see headlines that a vaccine is ready for distribution to the whole world.
BRENT OIL – TECHNICAL OUTLOOK
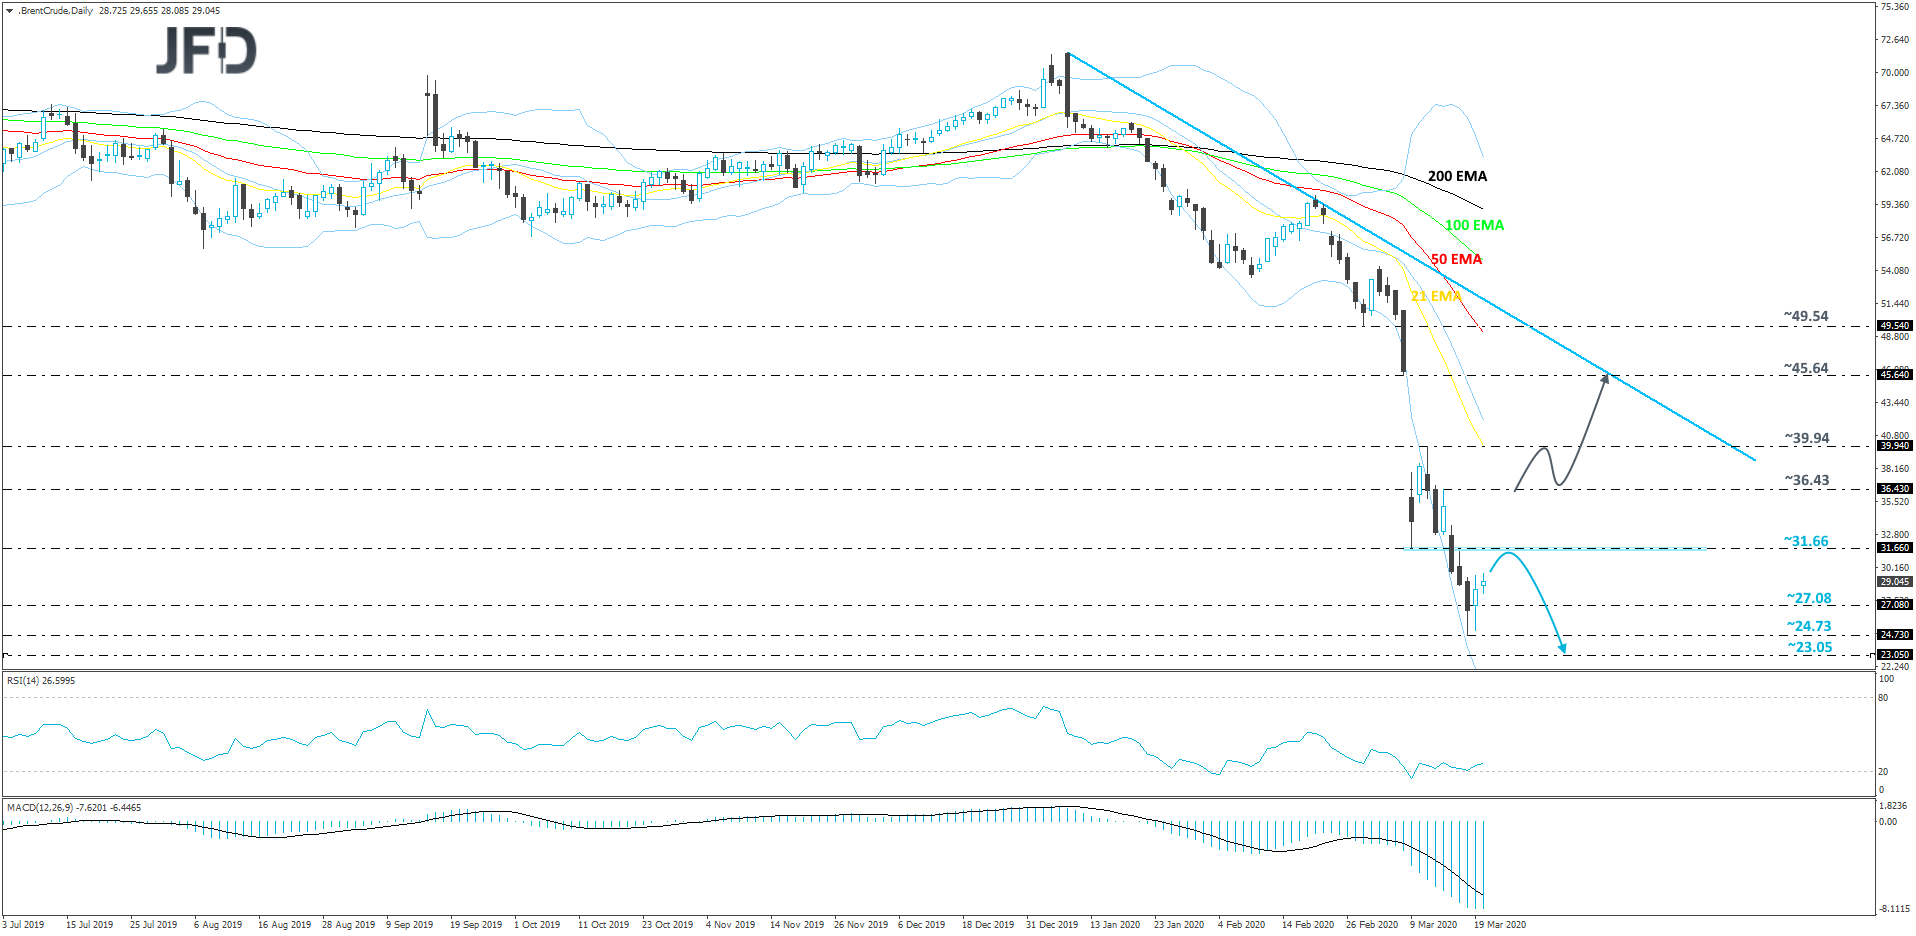
Overall, Brent oil continues to trade below its short-term tentative downside resistance line taken from the high of January 8th. From the beginning of March, the commodity has been falling sharply, which at one point this week led the price to a drop below the 2016 low, at 27.08. But as we can see, yesterday Brent oil clawed back above that low and today it remains above it. Although we could get another push to the upside, if the price stays below the 31.66 barrier, we will continue observing the downside as our main scenario, at least for now.
As mentioned above, a push a bit higher could test the 31.66 hurdle, which is the low March 9th. If that area stays intact, this could result in another slide, as the bears may take advantage of the higher price. The commodity might then drift back to the previously-mentioned 27.08 hurdle, a break of which may send Brent oil to the current low of this week, at 24.73. Slightly below that lies another possible support zone, at 23.05, which is the lowest point of April 2003.
Alternatively, if the commodity manages to get back above the previously-discussed 31.66 obstacle, this may spook the bears from the field temporarily. That said, more bulls could join in if Brent oil travels above the 36.43 barrier, marked by the high of March 13th. That may open the door for a move to the 39.94 area, which is the high of March 11th. The price could stall there temporarily, but if the buying continues, a further push north might test the 45.64 level, which is the low of March 6th. Around there, the commodity might also test the aforementioned downside line, which may provide additional resistance.
USD/NOK – TECHNICAL OUTLOOK
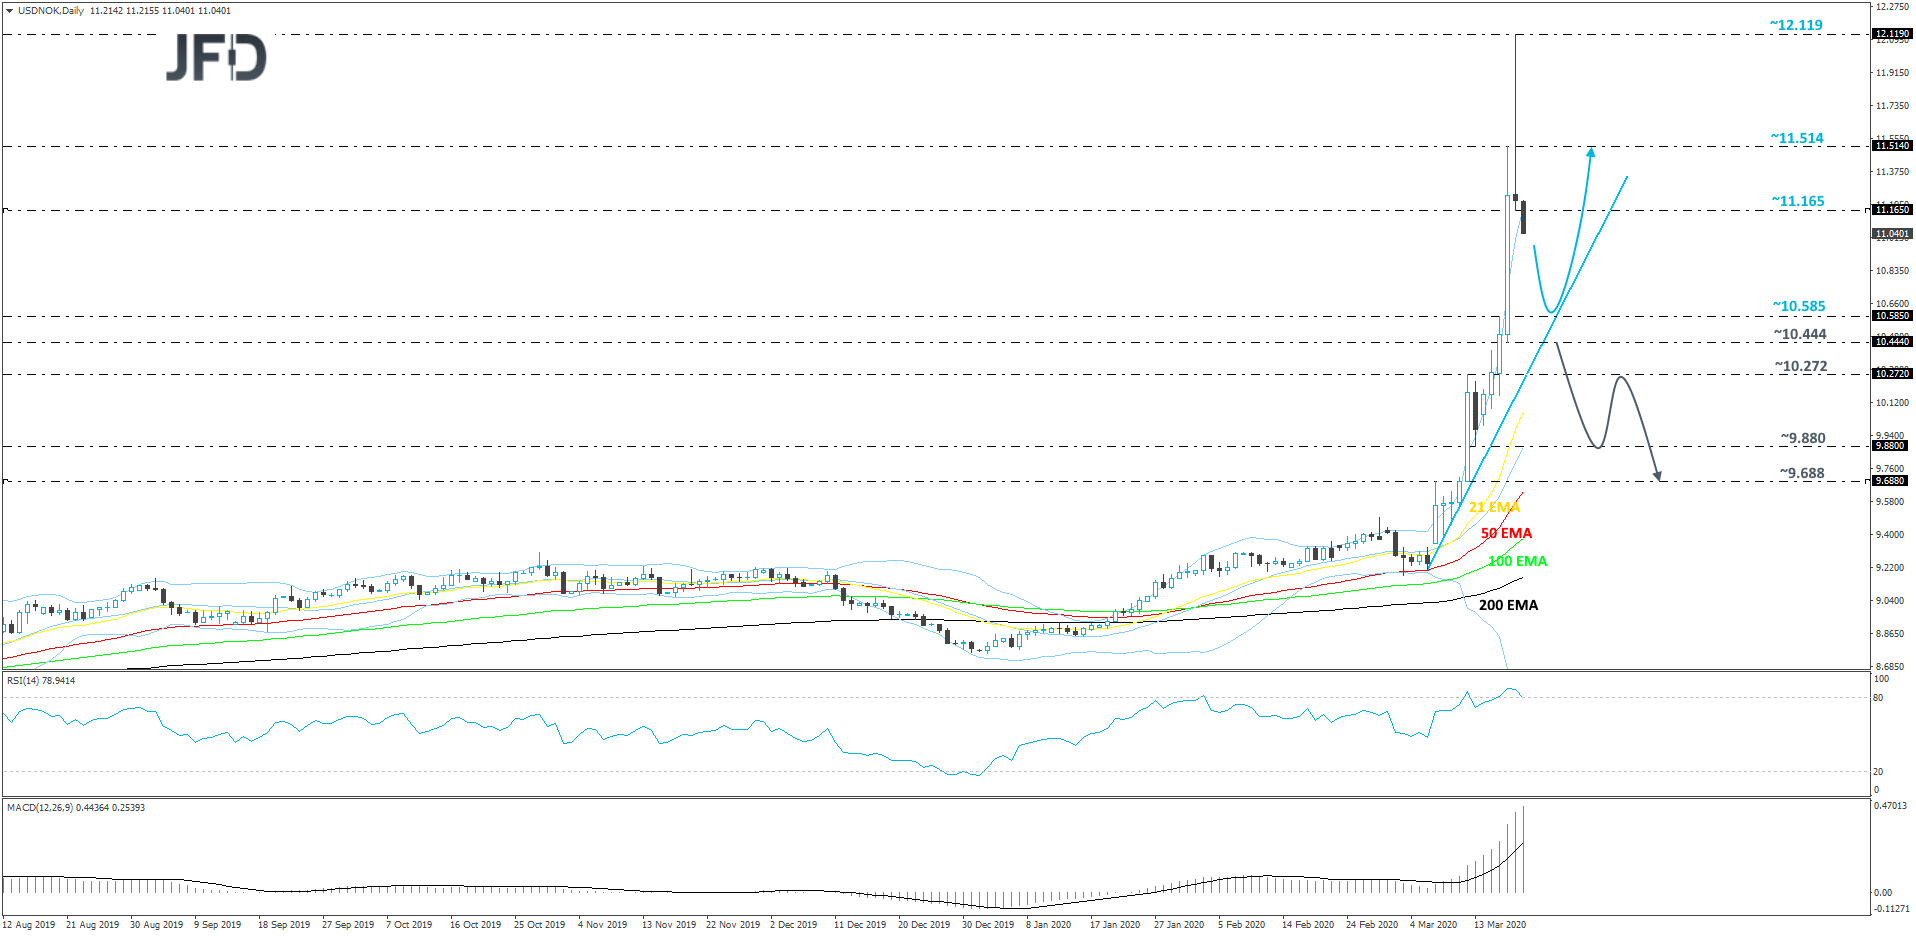
USD/NOK exploded to the upside this week, reaching a historic high near the 12.119 level. But yesterday, after hitting that level, the pair started correcting sharply to the downside. Today the slide continues. However, if the rate continues moving lower, but stays above its short-term tentative upside support line drawn from the low of March 6th, we may class this move as a temporary correction before another leg of buying.
As mentioned above, if the rate continues drifting lower and gets a hold-up near the aforementioned upside line, this could attract the bulls back into the field and help lift the pair up again. If so, we will once again aim for the 11.165 hurdle, marked by yesterday’s low, a break of which could set the stage for a push to the 11.514 level, marked by the high of March 18th.
On the other hand, if the aforementioned upside line breaks and the rate falls below the 10.444 hurdle, which is the low of March 18th, this may spook the buyers for a while and allow the sellers to take the steering wheel. USD/NOK could then fall to the 10.272 obstacle, a break of which may clear the path to the 9.880 zone, marked by the low of March 13th. Initially, the pair may stall around there, or even correct higher. However, if the rate stays below the 10.272 barrier, that might result in another round of selling, leading the rate back to the 9.880 area. If this time that area fails to provide good support and breaks, the next possible support level to consider could be the 9.688 hurdle, marked by the high of March 8th and the low of March 12th.
AS FOR TODAY’S EVENTS
From Canada, we get retail sales for January, while in the US, we have the existing home sales for February. Canada’s headline sales are expected to have risen 0.4% mom, after stagnating in December, while the core rate is expected to have declined to +0.2% mom from +0.5%. The US existing home sales are forecast to have rebounded 0.8% mom after sliding 1.3% in January.The financial community calmed somewhat yesterday following further easing measures by more central banks. Oil rebounded on Trump’s hints to intervene and stabilize prices, while the US dollar retreated after the Fed decided to supply via swaps nine additional nations with dollars.
RISK AVERSION EASES ON ADDITIONAL EFFORTS TO SOFTEN THE VIRUS ECONOMIC IMPACTThe dollar retreated against all but three of the other G10 currencies on Thursday and during the Asian morning Friday. It lost the most ground against NOK, AUD and NZD in that order, while it eked out some gains versus EUR, CHF and JPY.
The weakening of the safe havens and the strengthening of the risk-linked currencies suggest that risk aversion eased somewhat yesterday. Indeed, turning our gaze to the equity market, we see that major EU and US indices rebounded somewhat, with the calmness rolling into the Asian session today. China’s Shanghai Composite gained 1.61%, while Hong Kong’s Hang Seng and South Korea’s KOSPI advanced 4.25% and 7.44% respectively. Japanese markets were closed due to the Vernal Equinox holiday.
The relative calmness may have been the result of further easing measures by more central banks, including the Bo
E and the Norges Bank. The Bo
E decided to cut further its benchmark rate, by 15bps to +0.1% and noted that it will increase its holdings of government bonds, which means restarting QE. The Norges Bank also reduced rates, by 50bps to +1.00%, adding that is prepared to make further rate cuts if needed. Officials also said that they stand ready to intervene and lift the Krone, a move not taken in more than 20 years. This comes after the currency’s 30% tumble against the US currency, which was also fueled by the free fall in oil prices. We also had an SNB policy decision, but this Bank refrained from touching its already low interest rate of -0.75%. As we have been expecting, officials just strengthened their intervention language, noting that they will intervene more strongly in the FX market. They also added that the franc is now even more highly valued.
The Swiss franc was among the main losers yesterday, as apart from the broader market calmness, the SNB may have already been stepping up its intervention practices to keep the currency from strengthening further and this is evident by the sharp increases in total sight deposits week by week. Back to Norway and the Krone, this currency was the main gainer despite the 50bps cut by the Norges Bank. It could be due to Norges Bank’s intervention warnings but also due to the rebound in oil prices.
Both Brent and WTI gained 14.43% and 23.81% respectively yesterday, after US President Trump hinted that the US may initiate efforts to support prices at an “appropriate time”. The Trump administration is considering pushing Saudi Arabia to reduce production and to sanction Russia in order to force them do the same. The black liquid may have also been supported by US plans to buy oil for emergency stockpiling. The US’s attempts may keep prices supported for a while, but we doubt that they will be enough to offset the demand shortages due to the outbreak of the coronavirus. Thus, we would treat any further recovery in oil as a corrective move of the broader steep downtrend.
Now, back to the currencies and the US dollar, it’s pullback may have been the result of the Fed’s decision to supply via swaps nine additional nations with dollars. The Fed said that the swaps will allow other central banks to tap up to a total USD 450bn, in order to ensure that the USD-dependent financial system will continue to function.
Having said all that though, we stick to our guns that equities may have not hit a bottom yet, and the dollar may have not reached a peak. We repeat for the umpteenth time that the worst may not be behind us yet. The coronavirus continues to spread at an exponential pace, with new deaths and cases hitting new records yesterday. Namely, we had 26111 new infections and 1080 new deaths. We believe that the economic wounds could continue to deepen and that investors may soon abandon risk assets again in favor of safe havens, and even more in favor of the US dollar, which appears to be the refuge in extremely turbulence market conditions. With the CBOE volatility index (the VIX, or “fear index”) hovering around the 2008 crisis peak, no one can doubt that the phase we are going through is a turbulent one. In order to change our view, we would like to see headlines that a vaccine is ready for distribution to the whole world.
BRENT OIL – TECHNICAL OUTLOOKOverall, Brent oil continues to trade below its short-term tentative downside resistance line taken from the high of January 8th. From the beginning of March, the commodity has been falling sharply, which at one point this week led the price to a drop below the 2016 low, at 27.08. But as we can see, yesterday Brent oil clawed back above that low and today it remains above it. Although we could get another push to the upside, if the price stays below the 31.66 barrier, we will continue observing the downside as our main scenario, at least for now.
As mentioned above, a push a bit higher could test the 31.66 hurdle, which is the low March 9th. If that area stays intact, this could result in another slide, as the bears may take advantage of the higher price. The commodity might then drift back to the previously-mentioned 27.08 hurdle, a break of which may send Brent oil to the current low of this week, at 24.73. Slightly below that lies another possible support zone, at 23.05, which is the lowest point of April 2003.
Alternatively, if the commodity manages to get back above the previously-discussed 31.66 obstacle, this may spook the bears from the field temporarily. That said, more bulls could join in if Brent oil travels above the 36.43 barrier, marked by the high of March 13th. That may open the door for a move to the 39.94 area, which is the high of March 11th. The price could stall there temporarily, but if the buying continues, a further push north might test the 45.64 level, which is the low of March 6th. Around there, the commodity might also test the aforementioned downside line, which may provide additional resistance.
USD/NOK – TECHNICAL OUTLOOKUSD/NOK exploded to the upside this week, reaching a historic high near the 12.119 level. But yesterday, after hitting that level, the pair started correcting sharply to the downside. Today the slide continues. However, if the rate continues moving lower, but stays above its short-term tentative upside support line drawn from the low of March 6th, we may class this move as a temporary correction before another leg of buying.
As mentioned above, if the rate continues drifting lower and gets a hold-up near the aforementioned upside line, this could attract the bulls back into the field and help lift the pair up again. If so, we will once again aim for the 11.165 hurdle, marked by yesterday’s low, a break of which could set the stage for a push to the 11.514 level, marked by the high of March 18th.
On the other hand, if the aforementioned upside line breaks and the rate falls below the 10.444 hurdle, which is the low of March 18th, this may spook the buyers for a while and allow the sellers to take the steering wheel. USD/NOK could then fall to the 10.272 obstacle, a break of which may clear the path to the 9.880 zone, marked by the low of March 13th. Initially, the pair may stall around there, or even correct higher. However, if the rate stays below the 10.272 barrier, that might result in another round of selling, leading the rate back to the 9.880 area. If this time that area fails to provide good support and breaks, the next possible support level to consider could be the 9.688 hurdle, marked by the high of March 8th and the low of March 12th.
AS FOR TODAY’S EVENTSFrom Canada, we get retail sales for January, while in the US, we have the existing home sales for February. Canada’s headline sales are expected to have risen 0.4% mom, after stagnating in December, while the core rate is expected to have declined to +0.2% mom from +0.5%. The US existing home sales are forecast to have rebounded 0.8% mom after sliding 1.3% in January.
Daily Market Review: Markets Calm Somewhat on More Policy Easing
HIVE IS ALIVE!!!
JOIN US, YOU'LL HAVE EXACTLY THE SAME BALANCE AS YOU HAVE HERE ON STEEM WITHOUT THE CENTRALIZATION AND CENSORSHIP!!
https://hive.blog