Chart Of The Day: Oil Price Tug-Of-War Makes It Hard To Tell Which Way Next
The price of oil just crashed to below $25.00 as we write this. That's right below the intraday low and $26.21 closing price of February 2016. It's also in line with the commodity's 17-year low hit in 2003, a level we forecast crude would return to in a post from last August.
Naturally, at that time we couldn’t have known about coronavirus and its impact on the global economy and markets. Rather, we simply provided the technical picture, which set up a series of conditions. The market has been oversupplied for years. And, with the world under serious risk, those are all falling into place.
Now, with Saudi Arabia set to ship a record 10 billion barrels a day in an all-out battle with Russia for market share, oil’s long-term trend is headed lower. Goldman Sachs says consumption is down by 8 million barrels a day.
Institutions such as Goldman and Standard Chartered are now providing targets of $20 a barrel. Mizuho Securities warned oil prices could go even more negative, as Russia and Saudi Arabia flood the market.
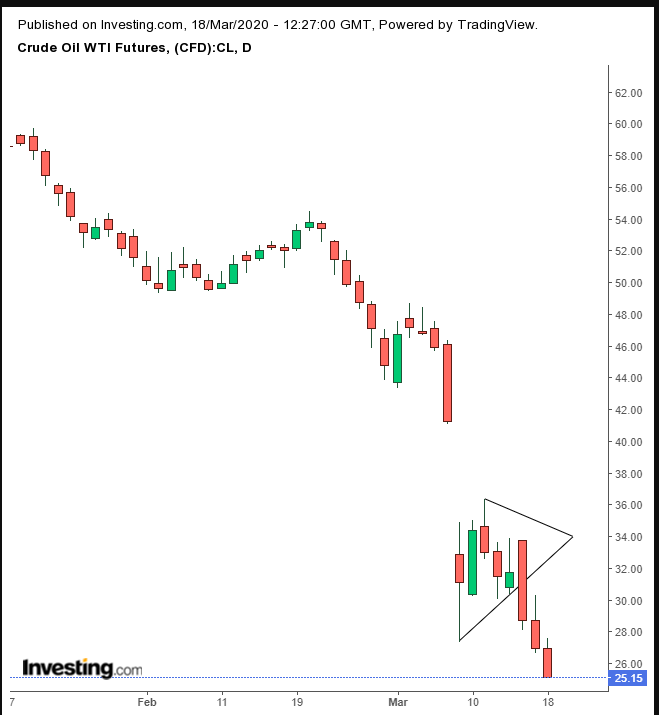
However, as we've said in previous posts, prices don’t move in a straight line. The decline could be slowing down, after having reached past the February 2016 low. Many investors remember and are aware of that price low since financial networks keep regurgitating it.
As well, $25 is a natural support, as it's very much a round number. This makes it a likely support to push prices back above the 2016 lows.
Of course, we can't know if that will happen. In addition, we recently called for another decline after the commodity completed a bearish pennant. These two forces are likely to be battling it out right now.
There's a good chance such a tug-of-war could send prices lurching in both directions—higher, then lower, in rapid swings. For disciplined risk-taking traders, in the short-term, it's a target rich environment.
TRADING STRATEGIES
Conservative traders should wait for the price to return and retest the pennant, in order to prove its resistance before trading down.
Moderate traders are likely to wait for a return move for a better entry, not necessarily for proof of trend.
Aggressive traders may enter a contrarian long position, if the price closes above the $25 mark, counting on a bounce at this historic level.
Trade Sample: Contrarian Long Position
Entry: $25.00
Stop-Loss: $24.00
Risk: $1
Target: $30.00
Reward: $5
Risk:Reward Ratio: 1:5
Note: A trade sample is just an example. Its only intent is to introduce the basic points to incorporate into a trade. No one trade can be right for everyone, nor can every trade win. You should adjust the trade according to your temperament and budget, while keeping an eye on the structure.
Original Post