Dubai Real Estate Rental Transactions: 08 April 2026
Dubai Real Estate Rental Transactions
08 April 2026
A total of 3,876 rental transactions were registered, with a combined value of AED 1,683,863,668. Activity was distributed across new and renewed contracts, with value concentration primarily in new agreements.
The dataset reflects full registry segmentation by contract structure, ownership, usage, property classification, and locality distribution.
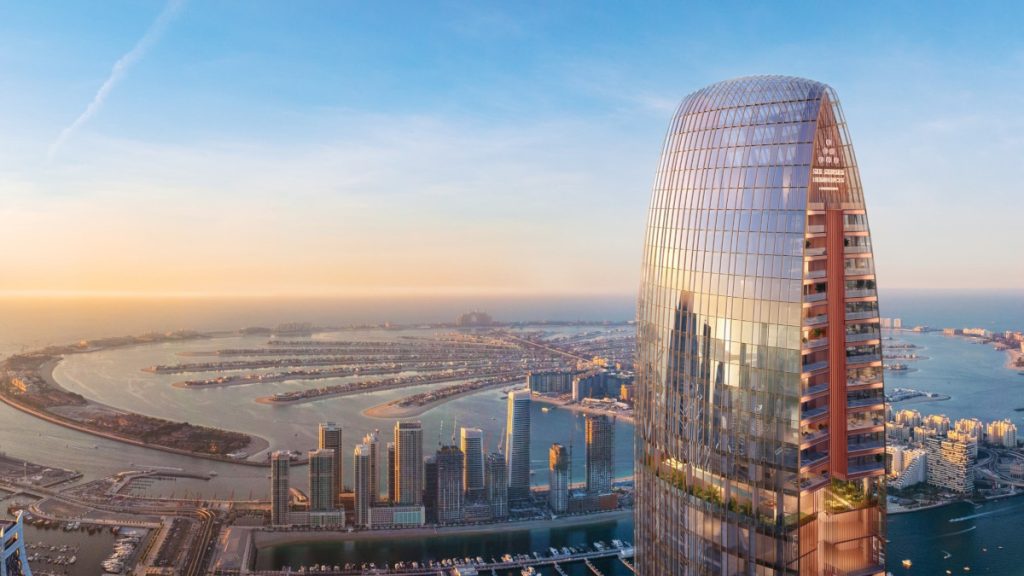
Six Senses Residences Dubai Marina Luxurious Sky Mansions & Penthouses
Source: Building Arabia.
Contract Type
| Category | Number of Transactions | Value (AED) | Value (USD) |
|---|---|---|---|
| New | 1693 | 1,329,787,472 | 362,093,253.10 |
| Renewed | 2183 | 354,076,196 | 96,412,851.19 |
| Grand Total | 3876 | 1,683,863,668 | 458,506,104.29 |
Property Ownership
| Category | Number of Transactions | Value (AED) | Value (USD) |
|---|---|---|---|
| Free Hold | 1789 | 1,032,795,472 | 281,224,090.40 |
| Non Free Hold | 2087 | 651,068,196 | 177,282,013.89 |
| Grand Total | 3876 | 1,683,863,668 | 458,506,104.29 |
Property Usage
| Category | Number of Transactions | Value (AED) | Value (USD) |
|---|---|---|---|
| Commercial | 1255 | 216,909,405 | 59,063,146.36 |
| Educational facility | 2 | 10,000,000 | 2,722,940.78 |
| Industrial | 6 | 674,447 | 183,647.92 |
| Residential | 2602 | 1,455,336,488 | 396,279,506.60 |
| Other | 11 | 943,329 | 256,862.90 |
| Grand Total | 3876 | 1,683,863,668 | 458,506,104.29 |
Property Type
| Category | Number of Transactions | Value (AED) | Value (USD) |
|---|---|---|---|
| A) Building | 1 | 60,000 | 16,337.64 |
| Factory | 1 | 60,000 | 16,337.64 |
| B) Land | 9 | 677,329 | 184,432.68 |
| Other | 9 | 677,329 | 184,432.68 |
| C) Unit | 3515 | 1,619,361,516 | 440,942,550.31 |
| Building | 1 | 37,500 | 10,211.03 |
| Clinic | 2 | 1,346,250 | 366,575.90 |
| Complex Warehouse | 1 | 140,800 | 38,338.87 |
| Flat | 2139 | 964,356,999 | 262,588,699.52 |
| Hotel | 9 | 1,824,000 | 496,664.40 |
| Kiosk | 4 | 631,050 | 171,831.18 |
| Labor Camps | 215 | 386,006,327 | 105,107,236.76 |
| Mezzanine | 1 | 100,000 | 27,229.41 |
| Nursery | 3 | 2,166,708 | 589,981.76 |
| Office | 670 | 107,585,702 | 29,294,949.49 |
| Parking | 1 | 264,000 | 71,885.64 |
| Restaurant | 1 | 327,888 | 89,281.96 |
| Shop | 341 | 79,407,490 | 21,622,189.24 |
| Showroom | 5 | 1,286,247 | 350,237.44 |
| Staff Accommodation | 47 | 65,800,000 | 17,916,950.44 |
| Storage | 1 | 192,735 | 52,480.60 |
| Store | 2 | 44,500 | 12,117.09 |
| Studio | 21 | 821,197 | 223,607.08 |
| Villa | 2 | 330,000 | 89,855.68 |
| Warehouse | 47 | 6,592,124 | 1,795,000.41 |
| Other | 2 | 100,000 | 27,229.41 |
| D) Villa | 192 | 57,636,365 | 15,694,040.84 |
| Arabian House | 1 | 180,000 | 49,012.93 |
| College | 2 | 10,000,000 | 2,722,940.78 |
| Complex Villas | 20 | 3,446,336 | 938,416.88 |
| Restaurant | 1 | 350,000 | 95,302.93 |
| Shop | 4 | 248,800 | 67,746.77 |
| Showroom | 3 | 8,316,000 | 2,264,397.55 |
| Villa | 161 | 35,095,230 | 9,556,223.28 |
| E) Virtual Unit | 159 | 6,128,459 | 1,668,743.09 |
| Office | 157 | 5,949,320 | 1,620,000.00 |
| Shop | 1 | 89,139 | 24,272.02 |
| Warehouse | 1 | 90,000 | 24,506.47 |
| Grand Total | 3876 | 1,683,863,668 | 458,506,104.29 |
Top 10 Localities by Value
| Category | Number of Transactions | Value (AED) | Value (USD) |
|---|---|---|---|
| Dubai Investment Park Second | 204 | 714,822,800 | 194,642,014.98 |
| Jabal Ali Industrial First | 92 | 348,682,244 | 94,944,109.98 |
| Me'Aisem First | 77 | 118,903,715 | 32,376,777.40 |
| Al Goze Industrial First | 53 | 66,701,509 | 18,162,425.87 |
| Al Wasl | 10 | 36,570,457 | 9,957,918.86 |
| Business Bay | 157 | 36,328,140 | 9,891,937.37 |
| Al Thanyah Fifth | 49 | 19,433,160 | 5,291,534.38 |
| Muhaisanah Second | 45 | 19,279,200 | 5,249,612.01 |
| Marsa Dubai | 52 | 12,654,842 | 3,445,838.54 |
| Port Saeed | 24 | 12,265,975 | 3,339,952.35 |
A total of 132 other localities recorded activity, contributing AED 318,221,626 in combined value. The next highest tiers include Al Warsan Third, Al Rowaiyah First, and Al Barsha Third.
New contracts accounted for the majority of value recorded during the day, while renewed agreements represented the larger share of transaction count. Residential usage continued to dominate overall value, with unit-based properties forming the bulk of registrations.
Transaction distribution remained concentrated in a limited number of high-value localities, with Dubai Investment Park Second and Jabal Ali Industrial First accounting for a substantial portion of total recorded value.
Disclaimer
This report is based on publicly available market transaction summaries and compiled data related to Dubai real estate activity for the stated period.
Figures are presented for informational purposes only and may vary from final official statistics published by the Dubai Land Department (DLD).
1 US Dollar = 3.6725 UAE Dirhams
This material does not constitute financial or investment advice. Real estate investments involve risk and readers should conduct independent research before making any investment decisions.