Dubai Real Estate Sales Transactions: 04 - 06 April 2026
Dubai Real Estate Sales Transaction Report
04 - 06 April 2026
The Dubai Land Department registered 834 real estate transactions between 04 and 06 April 2026, with a total recorded value of AED 3,165,323,890. Activity was concentrated in standard sales transactions, with off-plan properties leading in volume while ready properties accounted for a higher share of value.
The dataset below reflects the registry breakdown across transaction type, property status, ownership, usage, and classification.
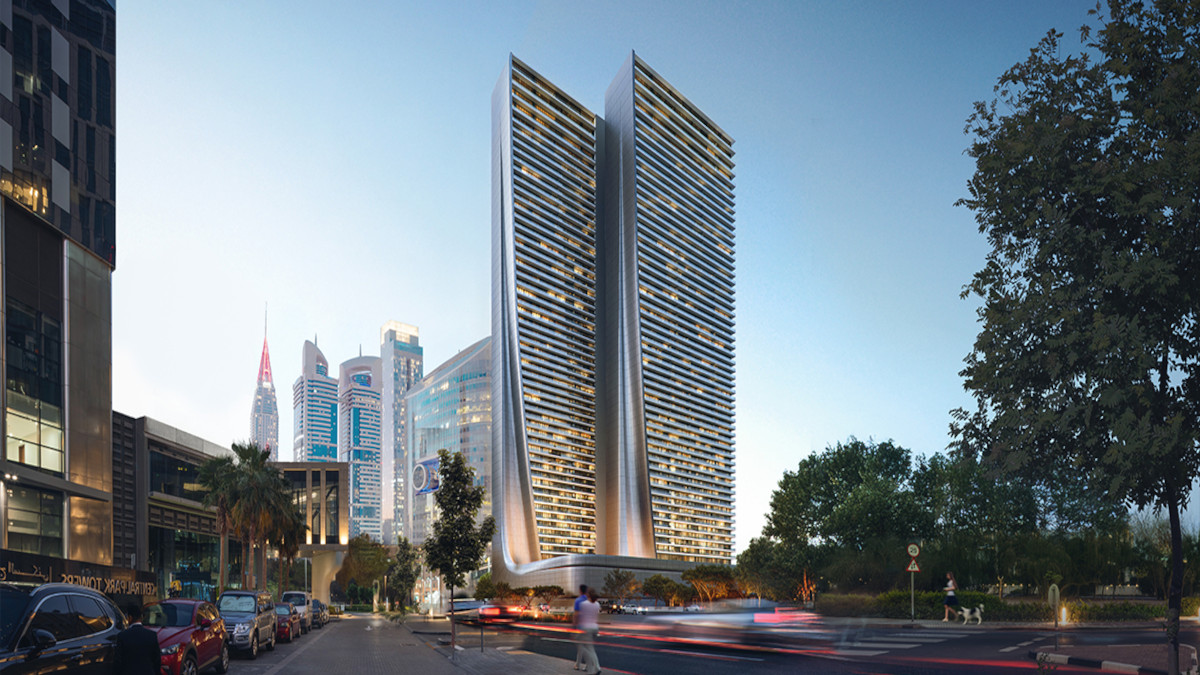
Akala Hotels & Residences Branded Residences in DIFC Area, Dubai
Source: Building Arabia.
Sales Type
| Category | Number of Transactions | Value (AED) | Value (USD) |
|---|---|---|---|
| Gifts | 20 | 467,466,349 | 127,288,318 |
| Mortgage | 167 | 605,796,928 | 164,954,916 |
| Sales | 647 | 2,092,060,613 | 569,655,715 |
| Grand Total | 834 | 3,165,323,890 | 861,898,949 |
Property Status
| Category | Number of Transactions | Value (AED) | Value (USD) |
|---|---|---|---|
| Off-Plan | 503 | 1,472,424,765 | 400,932,543 |
| Ready | 331 | 1,692,899,125 | 460,966,406 |
| Grand Total | 834 | 3,165,323,890 | 861,898,949 |
Property Ownership
| Category | Number of Transactions | Value (AED) | Value (USD) |
|---|---|---|---|
| Free Hold | 809 | 3,075,859,208 | 837,538,246 |
| Non Free Hold | 25 | 89,464,682 | 24,360,703 |
| Grand Total | 834 | 3,165,323,890 | 861,898,949 |
Property Usage
| Category | Number of Transactions | Value (AED) | Value (USD) |
|---|---|---|---|
| Commercial | 23 | 333,210,190 | 90,731,161 |
| Residential | 811 | 2,832,113,700 | 771,167,788 |
| Grand Total | 834 | 3,165,323,890 | 861,898,949 |
Property Type
| Category | Number of Transactions | Value (AED) | Value (USD) |
|---|---|---|---|
| A) Building | |||
| Building | 1 | 22,800,000 | 6,208,305 |
| Villa | 64 | 308,712,045 | 84,060,462 |
| Subtotal A) Building | 65 | 331,512,045 | 90,268,767 |
| B) Land | |||
| Commercial | 22 | 263,465,190 | 71,740,011 |
| General Use | 2 | 14,085,407 | 3,835,373 |
| Government Housing | 3 | 28,400,000 | 7,733,152 |
| Land | 2 | 23,555,000 | 6,413,887 |
| Residential | 41 | 586,033,778 | 159,573,527 |
| Residential / Attached Villas | 2 | 3,040,000 | 827,774 |
| Residential / Residential Villa | 1 | 1,000,000 | 272,294 |
| Residential Flats | 1 | 33,000,000 | 8,985,705 |
| Sports Club | 1 | 69,745,000 | 18,991,150 |
| Villa | 1 | 8,976,000 | 2,444,112 |
| Other | 5 | 138,388,204 | 37,682,288 |
| Subtotal B) Land | 81 | 1,169,688,578 | 318,505,127 |
| C) Unit | |||
| Flat | 654 | 1,383,665,482 | 376,763,916 |
| Hotel Apartment | 2 | 1,110,000 | 302,246 |
| Hotel Rooms | 3 | 3,476,940 | 946,750 |
| Office | 23 | 255,021,561 | 69,440,861 |
| Shop | 6 | 20,849,285 | 5,677,137 |
| Subtotal C) Unit | 688 | 1,664,123,268 | 453,130,910 |
| Grand Total | 834 | 3,165,323,890 | 861,898,949 |
Top 10 Localities by Value
| Category | Number of Transactions | Value (AED) | Value (USD) |
|---|---|---|---|
| BURJ KHALIFA | 16 | 581,752,772 | 158,407,834 |
| BUSINESS BAY | 39 | 287,647,271 | 78,324,648 |
| Palm Deira | 35 | 149,426,224 | 40,687,876 |
| Um Suqaim First | 1 | 129,549,246 | 35,275,492 |
| Jumeirah Second | 2 | 128,491,839 | 34,987,567 |
| Madinat Al Mataar | 48 | 108,026,090 | 29,414,865 |
| HORIZON | 8 | 89,864,262 | 24,469,506 |
| JUMEIRAH VILLAGE CIRCLE | 62 | 75,188,256 | 20,473,317 |
| Al Hebiah Fifth | 55 | 72,094,520 | 19,630,911 |
| Al Yelayiss 1 | 20 | 71,988,760 | 19,602,113 |
There were 92 other active localities during the period, with a combined transaction value of AED 1,571,294,650. Examples from the next highest activity levels include JUMEIRAH LAKES TOWERS, Dubai Investment Park Second, and Palm Jabal Ali.
Transaction activity over the period remained concentrated in residential units, particularly flats, which accounted for the majority of both volume and value within the Unit category. Land transactions, while fewer, represented a significant share of overall value, driven by large individual deals.
Freehold ownership continued to dominate registrations across all segments. The total recorded value for the period stands at AED 3,165,323,890 across 834 transactions.
Disclaimer
This report is based on publicly available market transaction summaries and compiled data related to Dubai real estate activity for the stated period.
Figures are presented for informational purposes only and may vary from final official statistics published by the Dubai Land Department (DLD).
1 US Dollar = 3.6725 UAE Dirhams
This material does not constitute financial or investment advice. Real estate investments involve risk and readers should conduct independent research before making any investment decisions.