Dubai Real Estate Sales Transactions: 4th Week June 2026
Dubai Real Estate Sales Transaction Report
Week 4 | 21 June – 27 June 2026
Dubai’s property market stayed active through the fourth week of June with solid movement across ready stock, off-plan inventory, and land deals. Volume stayed balanced across both ends of the market, while larger-ticket assets kept total transfer values elevated.
The spread this week was wide, with activity ranging from core apartment communities to premium waterfront districts and major land transactions.
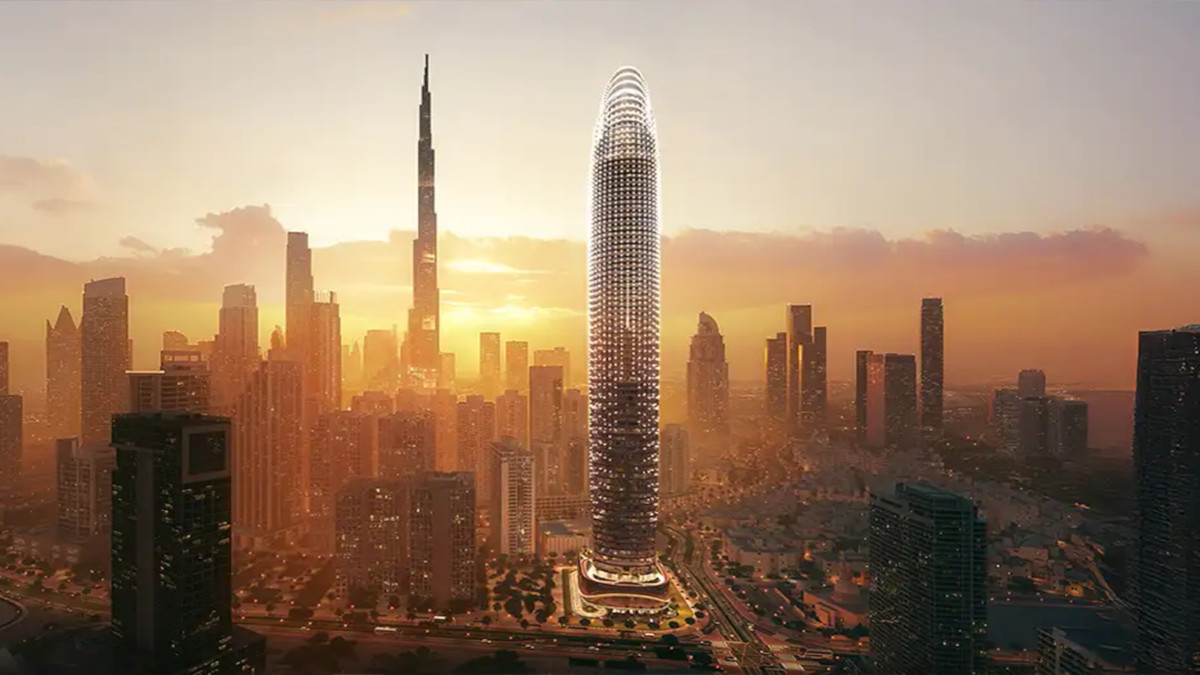
Live in the Sky: Discover Binghatti Skyblade on Burj Khalifa Boulevard
Source: Building Arabia.
1. Transactions by Sales Type
| Category | Number of Transactions | Value (AED) | Value (USD) |
|---|---|---|---|
| Gifts | 311 | 1,451,804,854 | 395,317,863.58 |
| Mortgage | 1045 | 2,821,079,862 | 768,163,338.87 |
| Sales | 3025 | 7,501,671,579 | 2,042,660,743.09 |
| Grand Total | 4381 | 11,774,556,295 | 3,206,141,945.54 |
2. Transactions by Property Status
| Category | Number of Transactions | Value (AED) | Value (USD) |
|---|---|---|---|
| Off-Plan | 2189 | 3,716,433,151 | 1,011,962,736.83 |
| Ready | 2192 | 8,058,123,144 | 2,194,179,208.71 |
| Grand Total | 4381 | 11,774,556,295 | 3,206,141,945.54 |
3. Transactions by Property Ownership
| Category | Number of Transactions | Value (AED) | Value (USD) |
|---|---|---|---|
| Free Hold | 4156 | 10,683,086,200 | 2,908,941,102.79 |
| Non Free Hold | 225 | 1,091,470,094 | 297,200,842.48 |
| Grand Total | 4381 | 11,774,556,295 | 3,206,141,945.54 |
4. Transactions by Property Usage
| Category | Number of Transactions | Value (AED) | Value (USD) |
|---|---|---|---|
| Commercial | 97 | 2,341,535,577 | 637,586,133.97 |
| Residential | 4284 | 9,433,020,718 | 2,568,555,811.57 |
| Grand Total | 4381 | 11,774,556,295 | 3,206,141,945.54 |
5. Transactions by Property Type
| Category | Number of Transactions | Value (AED) | Value (USD) |
|---|---|---|---|
| A) Building | 358 | 1,330,719,605 | 362,347,067.39 |
| - Villa | 358 | 1,330,719,605 | 362,347,067.39 |
| B) Land | 436 | 4,750,326,736 | 1,293,485,836.90 |
| - Airport | 3 | 10,003,704 | 2,723,949.35 |
| - Commercial | 92 | 1,594,835,577 | 434,264,282.37 |
| - General Use | 6 | 126,735,996 | 34,509,461.13 |
| - Government Housing | 5 | 15,717,779 | 4,280,007.89 |
| - Health Club | 1 | 74,800,000 | 20,367,597.00 |
| - Industrial | 2 | 64,900,000 | 17,671,885.64 |
| - Labor Camp | 1 | 32,000,000 | 8,713,410.48 |
| - Land | 7 | 363,136,518 | 98,879,923.21 |
| - Residential | 234 | 1,073,899,677 | 292,416,522.12 |
| - Residential / Residential Villa | 30 | 33,629,419 | 9,157,091.63 |
| - Residential / Villas | 2 | 36,420,000 | 9,916,950.31 |
| - Residential Flats | 11 | 267,479,546 | 72,833,096.26 |
| - School | 1 | 74,592,435 | 20,311,078.28 |
| - Sports Club | 1 | 575,000,000 | 156,569,094.76 |
| - Unit | 2 | 63,001,021 | 17,154,804.90 |
| - Villa | 2 | 109,986,504 | 29,948,672.43 |
| - Other | 36 | 234,188,560 | 63,768,157.93 |
| C) Unit | 3587 | 5,693,509,953 | 1,550,309,041.25 |
| - Flat | 3259 | 4,963,405,746 | 1,351,506,003.00 |
| - Hotel Apartment | 138 | 212,811,505 | 57,947,312.46 |
| - Hotel Rooms | 26 | 21,970,077 | 5,982,321.85 |
| - Office | 103 | 360,518,663 | 98,167,096.80 |
| - Shop | 59 | 130,873,963 | 35,636,205.04 |
| - Warehouse | 2 | 3,930,000 | 1,070,115.73 |
| Grand Total | 4381 | 11,774,556,295 | 3,206,141,945.54 |
6. Top 10 Localities by Value
| Category | Number of Transactions | Value (AED) | Value (USD) |
|---|---|---|---|
| BUSINESS PARK | 39 | 647,449,762 | 176,296,735.74 |
| Madinat Al Mataar | 416 | 591,986,581 | 161,194,440.03 |
| BUSINESS BAY | 182 | 557,321,833 | 151,755,434.31 |
| JUMEIRAH VILLAGE CIRCLE | 285 | 507,571,834 | 138,208,804.36 |
| EMIRATE LIVING | 32 | 490,782,868 | 133,637,268.35 |
| JUMEIRA BAY | 2 | 389,997,253 | 106,193,942.27 |
| MEYDAN ONE | 210 | 366,300,320 | 99,741,407.76 |
| BURJ KHALIFA | 98 | 358,354,890 | 97,577,914.23 |
| DUBAI HILLS | 50 | 305,597,749 | 83,212,457.18 |
| Al Hebiah Fifth | 116 | 303,607,277 | 82,669,099.25 |
| Subtotal (Top 10) | 1430 | 4,518,970,367 | 1,230,488,873.48 |
| Remaining Localities (165) | 2951 | 7,255,585,928 | 1,975,653,072.06 |
| Grand Total | 4381 | 11,774,556,295 | 3,206,141,945.54 |
Outside the top ten, PALM JUMEIRAH, DUBAI SPORTS CITY, and Jabal Ali First remained among the stronger-performing districts, keeping depth in the market beyond the headline locations.
Conclusion
The week closed with broad coverage across 175 localities, showing deal flow staying active across both established and emerging zones. Land carried heavy value, units dominated volume, and the split between ready and off-plan stayed nearly even.
Disclaimer
This report is based on publicly available market transaction summaries and compiled data related to Dubai real estate activity for the stated period.
Figures are presented for informational purposes only and may vary from final official statistics published by the Dubai Land Department (DLD).
1 US Dollar = 3.6725 UAE Dirhams
This material does not constitute financial or investment advice. Real estate investments involve risk and readers should conduct independent research before making any investment decisions.