Topological analysis of gas and oil using petrophysical data
The explosion of data in the energy sector is simply fascinating, the depth and breath of digital data has completely transformed how energy is discovered, produced and stored.
Having a view of a drilling for example, there are from active and passive seismic sensors to the complex borehole sensor data, which makes drilling and completion operations a massive way of data recopilation. The challenge for drillers, and for the industry at large, is how to turn these stores of data into actionable insights.
Topological Data Analysis (TDA) is a recent and fast growing way of extracting and providing a set of new topological and geometric tools to infer relevant features for possibly complex data.
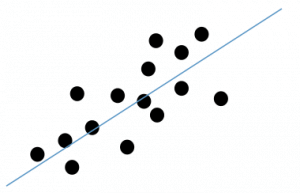
TDA uses topology, the mathematical study of geometrical shape, to understand complex datasets. Linear regression, the fitting of a straight line to a cloud of points on a plane, is perhaps the most rudimentary type of topological data analysis all scientists and engineers are familiar with.
A cloud of points on a plane roughly distributed along a circle is another familiar shape that is associated with periodicity.
Groups of points on a plane also have a topological interpretation in terms of disconnected, i.e., independent logical units. Another familiar shape is the Y junction that is associated with bifurcation phenomena.

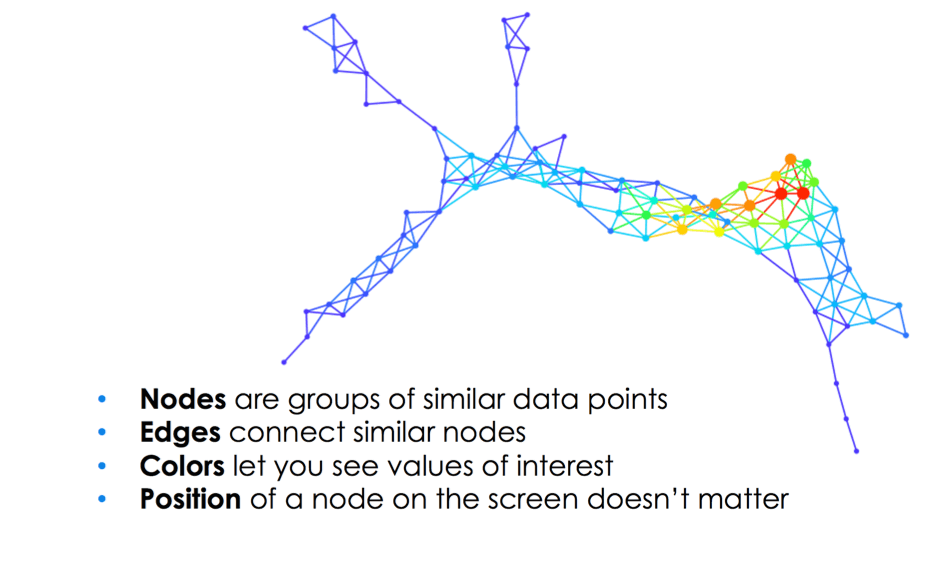
The idea behind the application of TDA is to represent data via topological networks, i.e., data is represented by grouping similar data points into nodes, and connecting the nodes by an edge if the corresponding nodes have at least a data point in common.
Because each node represents multiple data points, the network gives a compressed, low dimensional version of extremely high dimensional data. When used as a framework in conjunction with machine learning, TDA enables the understanding of the shape of complex data sets, highlighting previously hidden groups of data, and revealing the relevant explanatory variables.

Having defined groups with well-defined marginal distributions, it is possible to define the main variables that characterize each group, and define models with unprecedented predictive precision.
Now including production, completion, seismic, microseismic, and geomechanical data to the mix and- thanks to TDA- the oil and gas industry has a new powerful and flexible tool in this exploration and production toolbox, which now allows the solution of previously hopeless decision problems.
Hi! I am a robot. I just upvoted you! I found similar content that readers might be interested in:
https://d1bp1ynq8xms31.cloudfront.net/wp-content/uploads/2015/07/2015_URTeC_Paper_Cortis.pdf