The Histogram: A Photographer’s Best Friend - A Short Guide to the Histogram for Photographers
Dear Steemians!
I’m pleased to write for you another photography tutorial. This time we’re going to go a little bit beyond the basics in order to understand the histogram.
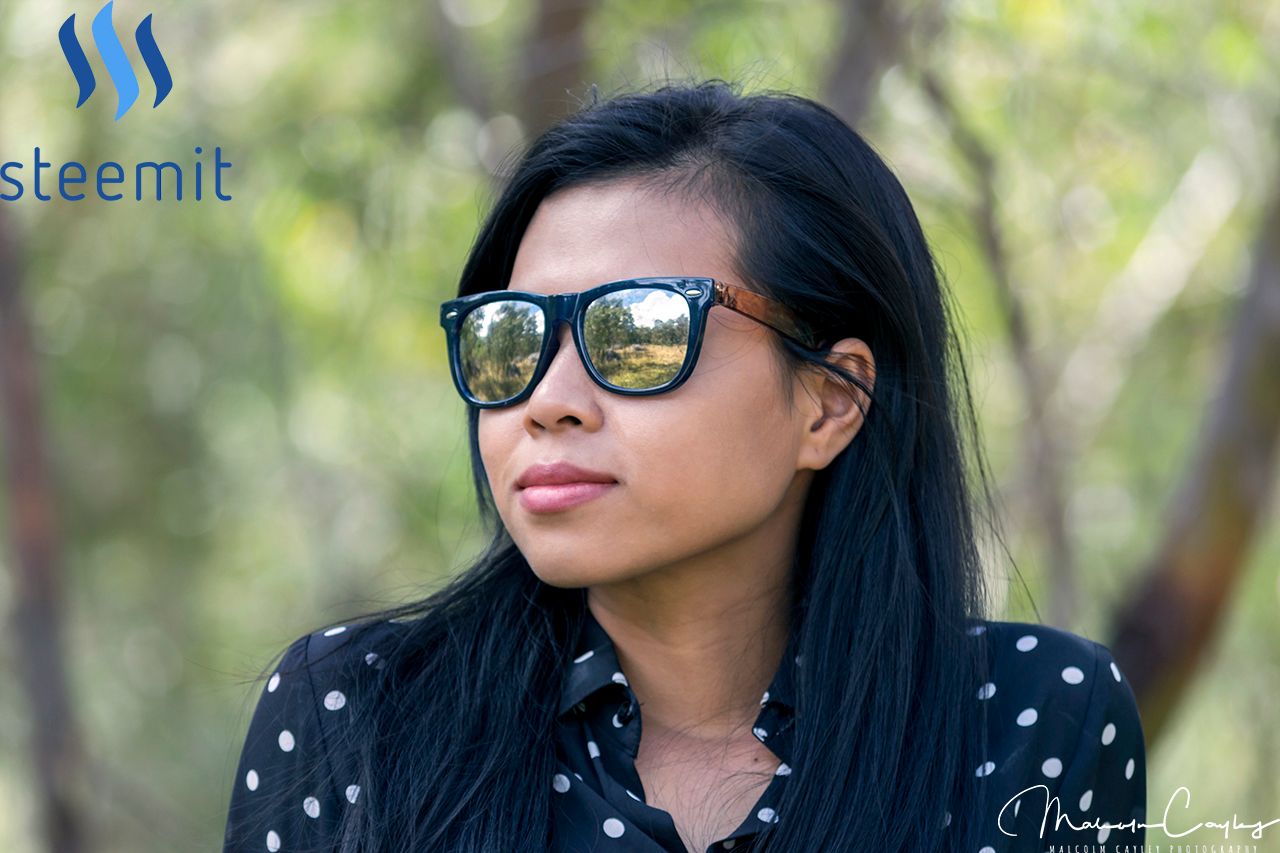
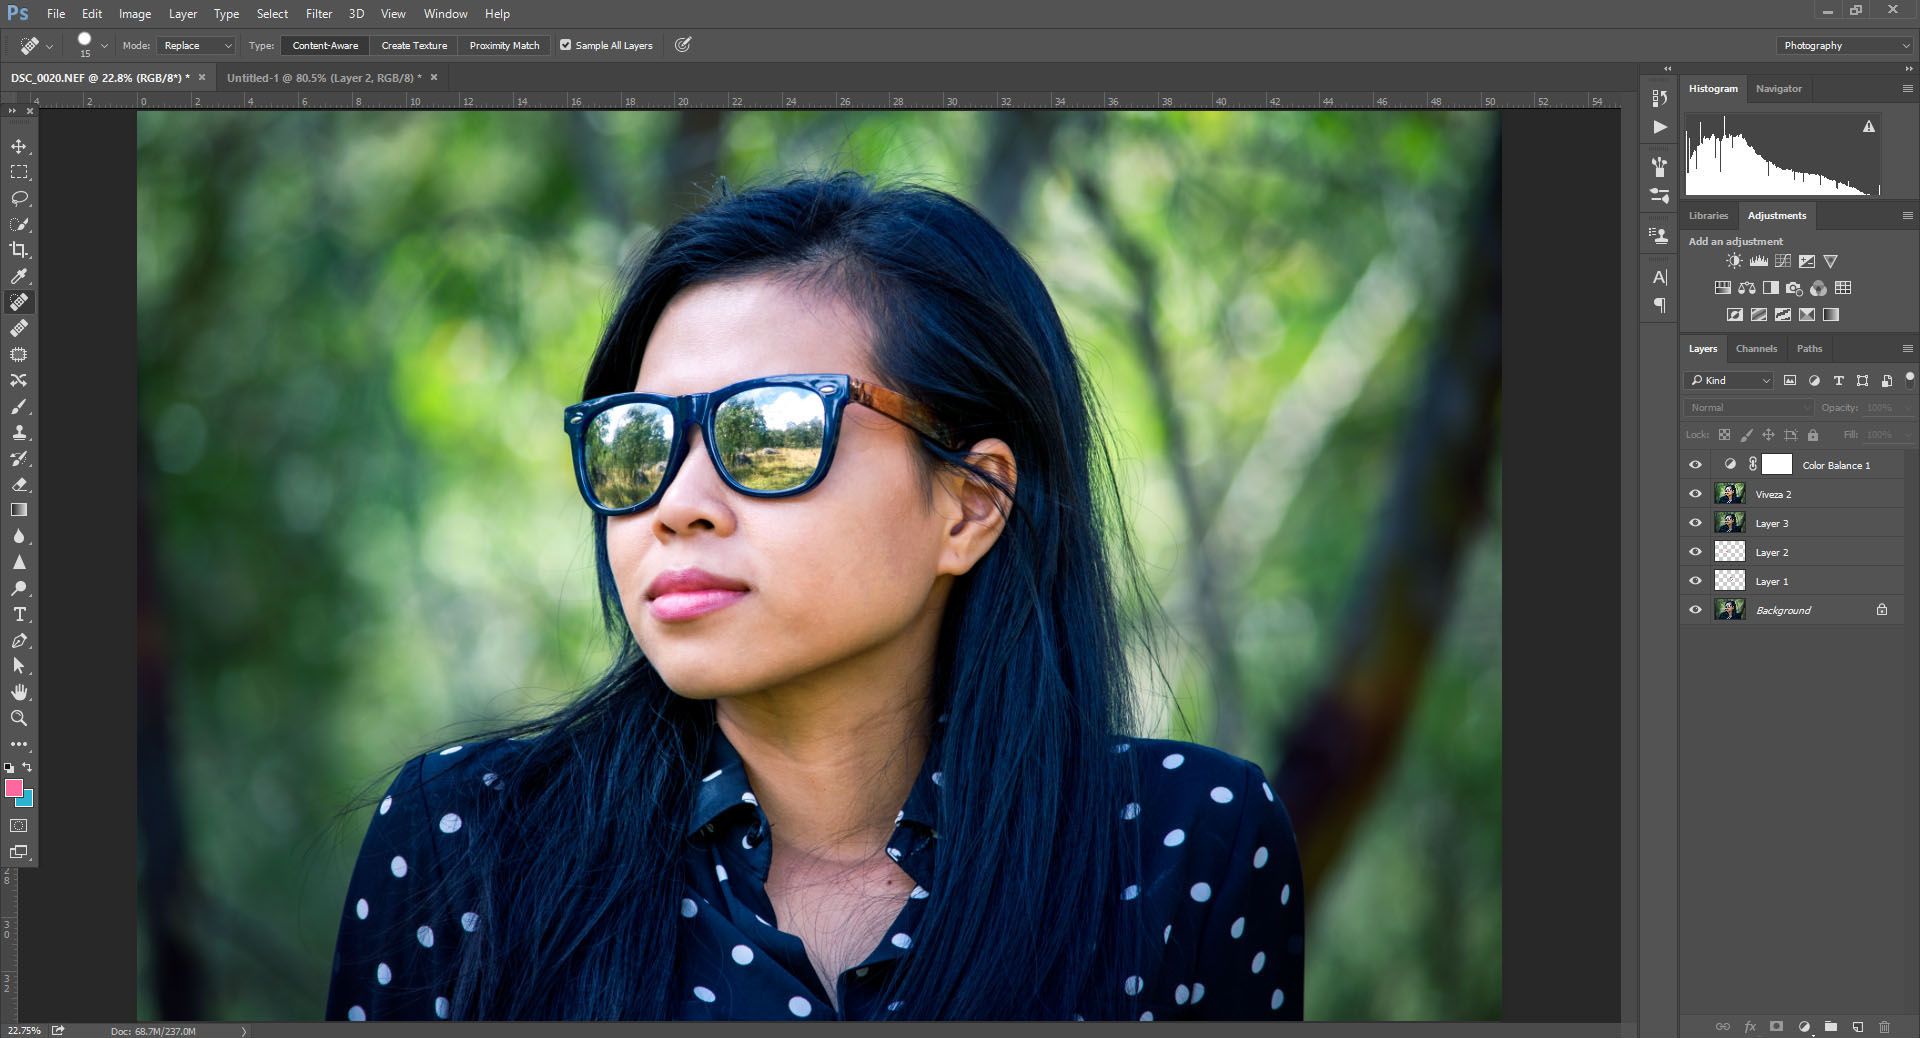
(Final result: many more adjustments could be applied to this image but, as you will see below, it's already had a lot of work done to it)
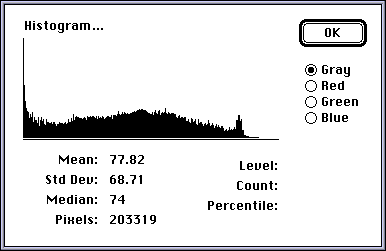
A histogram, according to a Google search, is “a diagram consisting of rectangles whose area is proportional to the frequency of a variable and whose width is equal to the class interval”. While this statistical definition is very impressive it doesn’t really help the photographer understand what it is and how it can help you when you’re editing your photos.
Taking a photo usually gives you a histogram. If you shoot in RAW (you really should if you don’t care about space: buy a massive SD card they’re worth it) you will retain all of the data that was contained within the exposure. Shooting in JPEG causes your camera to discard pieces of data. In other words: shooting in JPEG compresses the amount of data that will be displayed in the histogram.
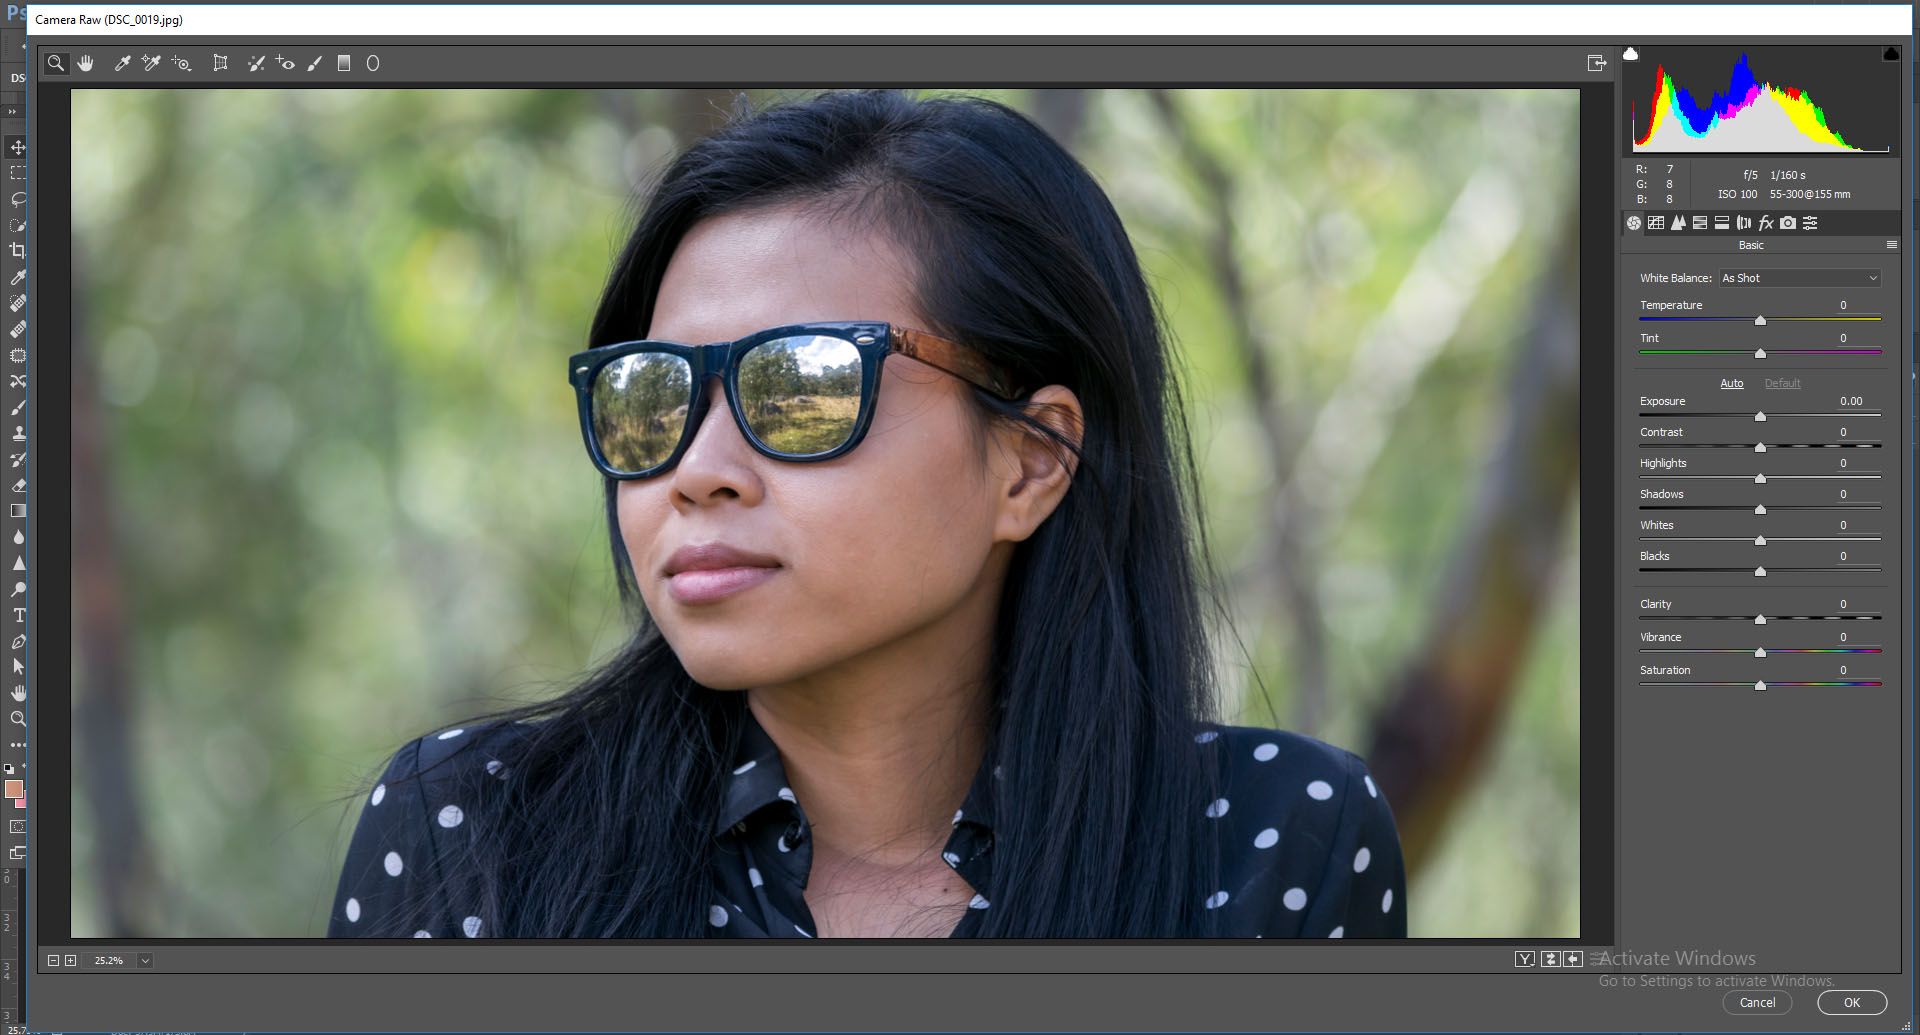
(We begin with a dull image)
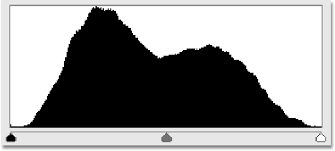
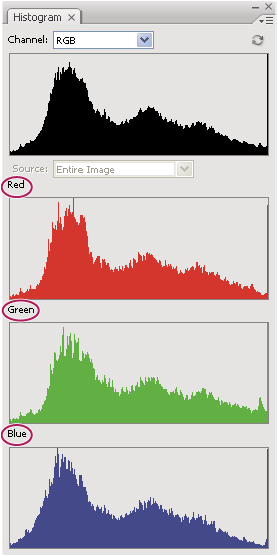
The histogram displays the information from the luminance, red, green, and blue (RGB) channels of data. The data is being displayed to you from 0 (pure black) to 100 (pure white). In between these extremes should be the majority of the data that represents your well exposed image.
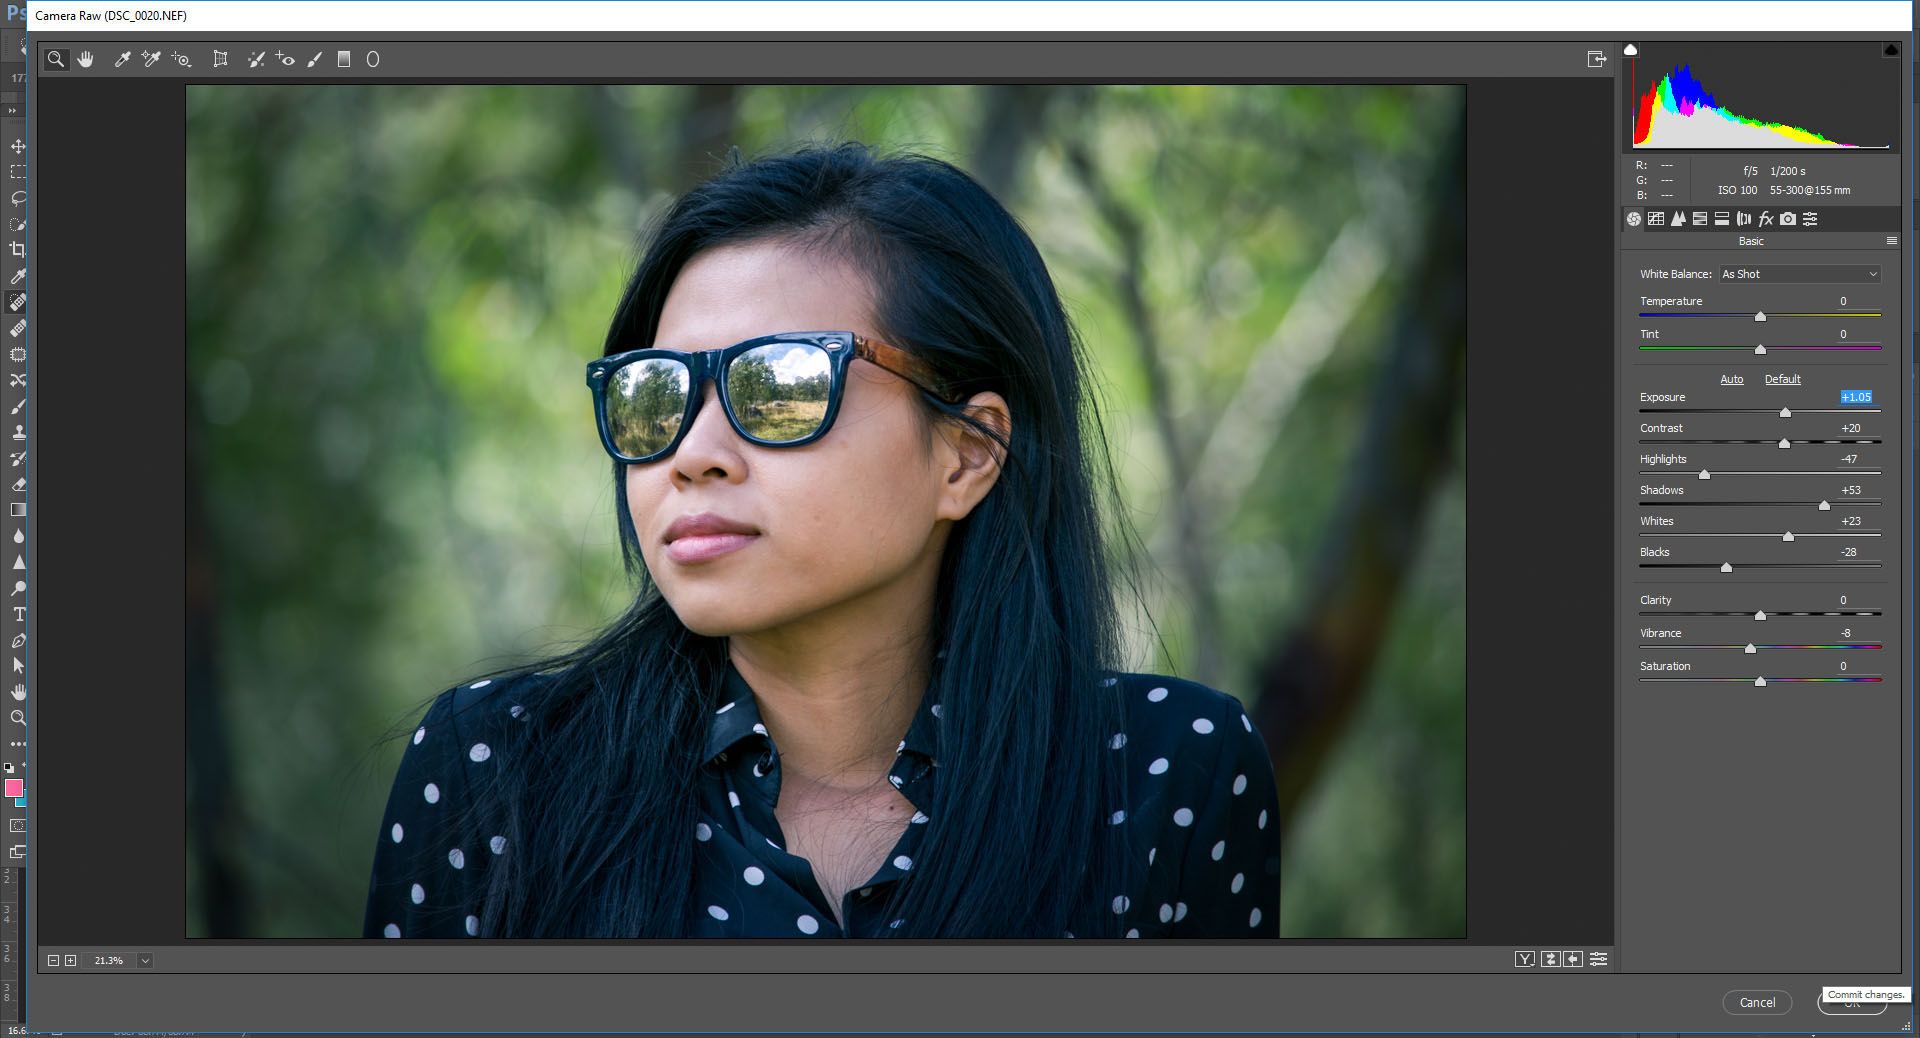
(Adjust to breathe some life into the image)
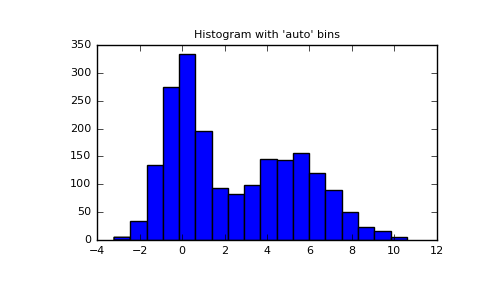
An underexposed or night/indoor/low light image will have the majority of the data towards the left of the histogram. An overexposed image will have the majority of the data towards the right side of the histogram. A well exposed image should have the majority of the data balanced across the histogram. Super values or those above 100 (pure white) are possible when shooting in RAW. Remember that these values cannot be displayed on your monitors and devices and so are always reduced to remain within the 0-100 spectrum.
(The image is over-exposed and the colour balance is off [there's too much red in the highlights and blue in the shadows] - check the first image of the post to see the final result after much tweaking to get a more natural result)
The histogram can represent specific channels if you want to look at how much of the red, blue, or green channels make up the image. The luminance channel is separate from the colour channels. If you decide to transform your colour image into black and white the colour channels are discarded, leaving only the luminance channel remaining. Sometimes the RGB channel will be displayed as a collective representation of the image while other programs distinguish between them. It’s not that complex though, just remember the three colour channels used to make up an image for web and the luminance channel that represents value.
Lightroom subdivides the histogram into (from left to right) Blacks, Shadows, Exposure, Highlights, and finally Whites. The terminology always seems to change between software but essentially Lightroom is referring to the way in which you can manipulate the data within your image in order to bring out its true potential. Thus, there’re sliders for blacks and whites, shadows and highlights that control their respective data clusters. Exposure is a midpoint controller that can bring an under or over exposed image back towards the middle. Controlling the shadows and the highlights can also be referred to as bringing back detail or reducing it from the shadows or the highlights. Photoshop's Camera RAW is basically the same with less features (press ctrl + shift + a to access or from the filters menu).
The exact clustering of data representing your image is going to vary from photo to photo based on the time of day, location, and how you took the image (shooting under or over exposed or both for HDRs). I tend to shoot some of my images underexposed and don’t really dwell on what they look like in the camera. Magic for me always happens in post. Shooting a good exposure helps but modern post-processing suites like Lightroom and Photoshop can usually handle about 5 stops under or over. This means that you can usually get away with more than you should in camera. Once you start changing the data using filters like levels or contrast or Camera RAW the histogram will change to reflect the changes you’re making.
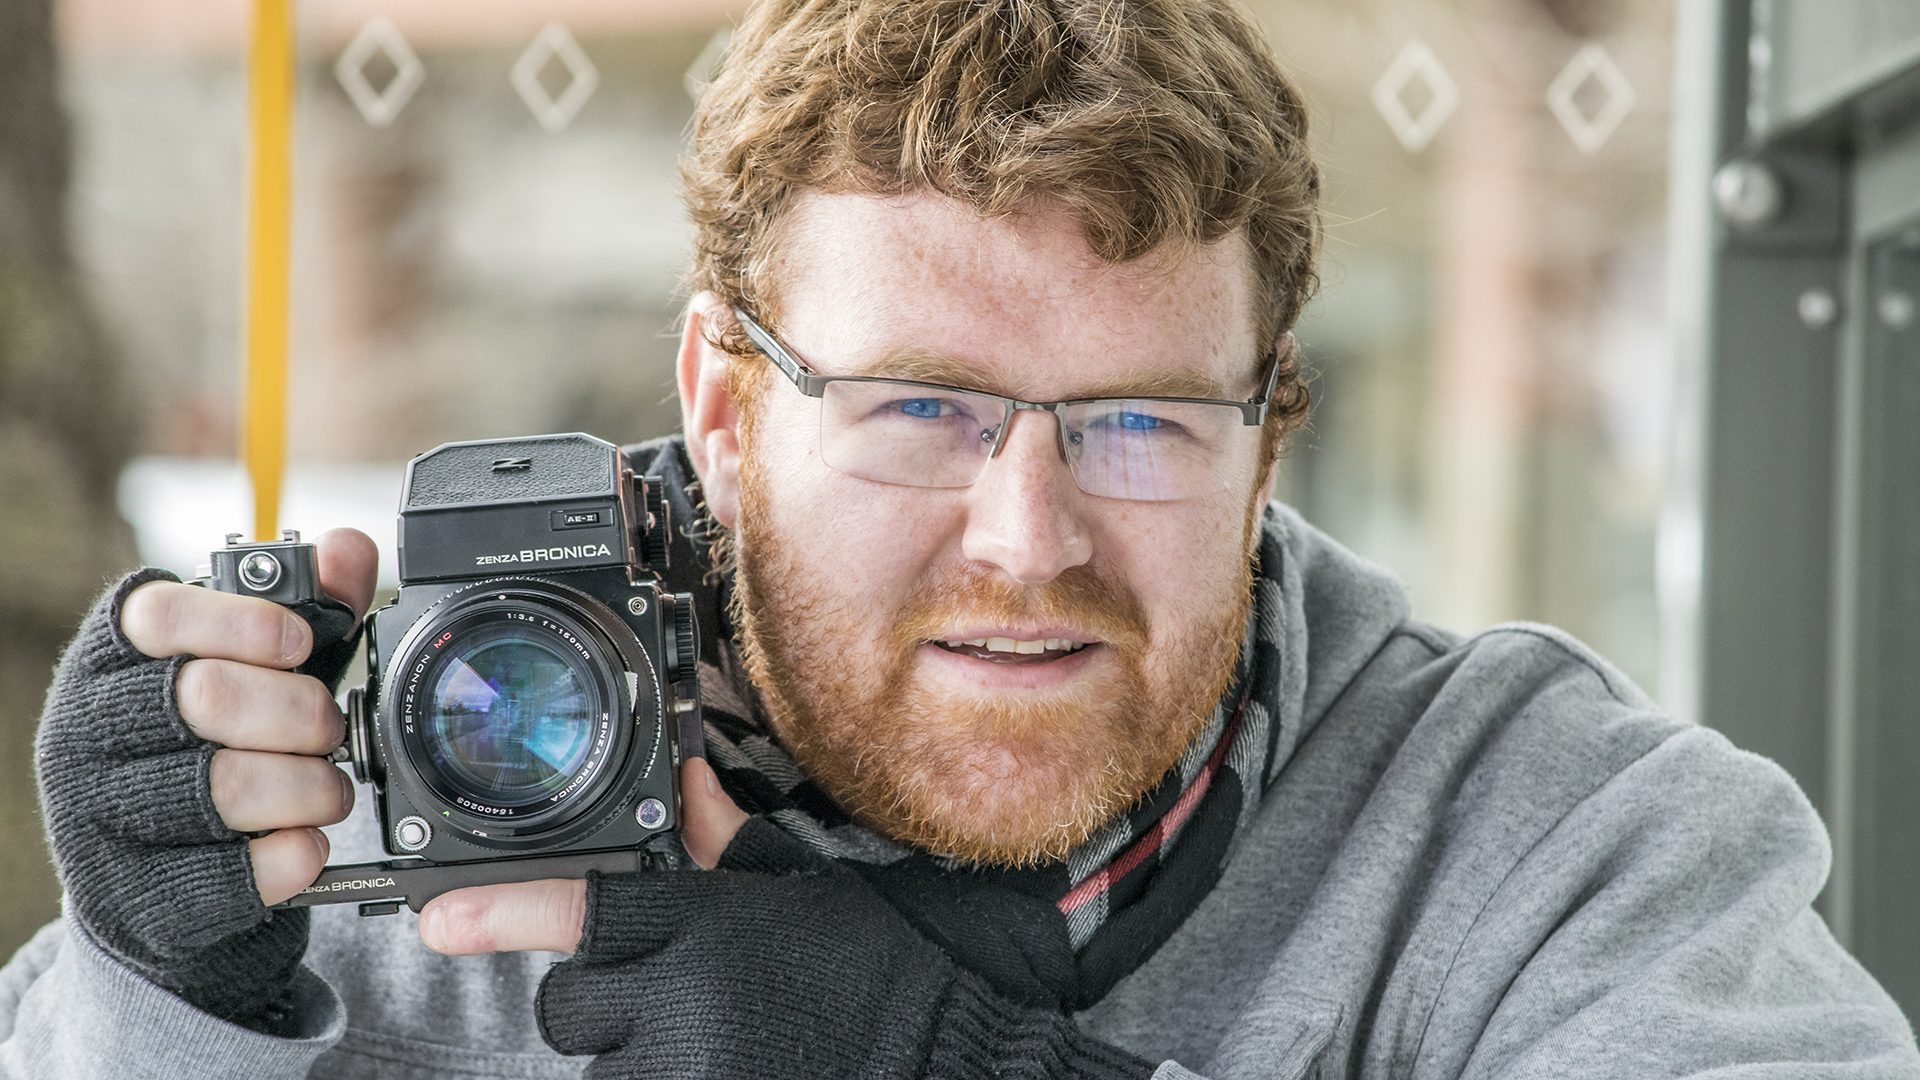
(Special treat: a very rare behind the lens with my Zenza Bronica ETRS, a lovely medium format film camera from the 1980s that shoots 120/220/135)
Remember the histogram is just a tool that measures the data in the image. There is no right or wrong histogram because it really depends on what type of image you’re trying to achieve.
Thanks for reading! If the terminology is unclear please let me know!
As always, questions, comments, and polite feedback most welcome :)
Thanks for sharing.
The colors are amazing!! @deterrencepolicy
Thanks @nguyenle :)
In formative! Thanks you for the info. I've learned something :) Cheers to you
Glad you found it helpful :) Check out some of my other posts if you're interested in learning some more :)
Cool pics! I followed!
Thanks! :)
24 WTF Photographs From When New York Went Totally Dark In 1977.
https://steemit.com/photography/@swaticute/24-wtf-photographs-from-when-new-york-went-totally-dark-in-1977
What is this? Please don't spam my posts!