Dubai Real Estate Sales Transactions - 18 March 2026
Dubai Rental Transactions
Registered Monday, 18 March 2026
A total of 3,270 rental transactions were registered on Wednesday, 18 March 2026, with a combined value of AED 634,213,499.
Renewals accounted for the majority of transactions by volume, while new contracts represented the larger share of total value. Activity remained concentrated in residential units, with commercial assets contributing a significant portion of overall value.
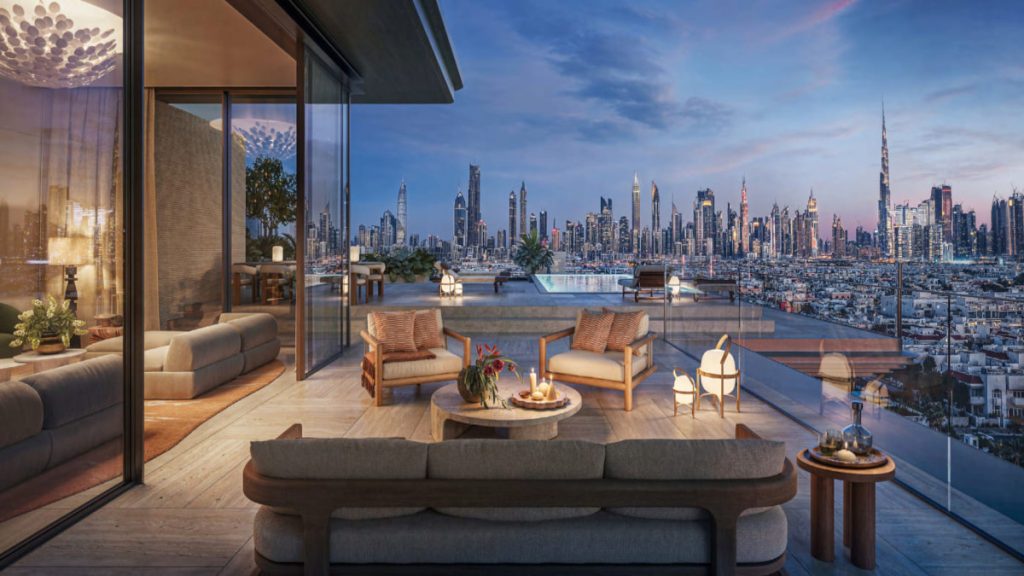
Solaya by Meraas Ultra Luxury Beachfront Residences at La Mer Beach, Dubai
Source: Building Arabia.
Transactions by Contract Type
| Category | Number of Transactions | Value (AED) | Value (USD) |
|---|---|---|---|
| New | 1266 | 394,761,961 | 107,564,567 |
| Renewed | 2004 | 239,451,538 | 65,245,651 |
| Grand Total | 3270 | 634,213,499 | 172,810,218 |
Transactions by Property Ownership Type
| Category | Number of Transactions | Value (AED) | Value (USD) |
|---|---|---|---|
| Free Hold | 1636 | 291,898,707 | 79,536,432 |
| Non Free Hold | 1634 | 342,314,792 | 93,273,785 |
| Grand Total | 3270 | 634,213,499 | 172,810,218 |
Transactions by Property Usage
| Category | Number of Transactions | Value (AED) | Value (USD) |
|---|---|---|---|
| Commercial | 767 | 295,275,331 | 80,456,493 |
| Health Facility | 1 | 6,700,000 | 1,825,613 |
| Industrial | 6 | 1,245,766 | 339,446 |
| Residential | 2485 | 329,064,343 | 89,663,309 |
| Other | 11 | 1,928,059 | 525,357 |
| Grand Total | 3270 | 634,213,499 | 172,810,218 |
Transactions by Property Type
| Category | Number of Transactions | Value (AED) | Value (USD) |
|---|---|---|---|
| A) Building | 1 | 220,000 | 59,946 |
| Shop | 1 | 220,000 | 59,946 |
| B) Land | 10 | 1,889,209 | 514,771 |
| Other | 10 | 1,889,209 | 514,771 |
| C) Unit | 2902 | 536,695,157 | 146,238,462 |
| Clinic | 2 | 180,000 | 49,046 |
| Flat | 2042 | 167,999,227 | 45,776,356 |
| Health club | 1 | 200,000 | 54,496 |
| Hotel | 23 | 4,003,000 | 1,090,736 |
| Kiosk | 1 | 108,000 | 29,428 |
| Labor Camps | 206 | 93,753,798 | 25,545,994 |
| Office | 296 | 116,045,166 | 31,620,000 |
| Open space | 1 | 280,000 | 76,294 |
| Parking | 4 | 1,185,000 | 322,888 |
| Shop | 258 | 122,920,730 | 33,493,387 |
| Showroom | 9 | 23,761,427 | 6,474,503 |
| Staff Accommodation | 3 | 108,000 | 29,428 |
| Storage | 1 | 10,500 | 2,861 |
| Studio | 24 | 866,465 | 236,094 |
| Warehouse | 30 | 5,175,346 | 1,410,176 |
| Warehouse complex | 1 | 98,499 | 26,839 |
| D) Villa | 221 | 78,938,704 | 21,509,184 |
| Clinic | 1 | 1,500,000 | 408,719 |
| Complex Villas | 11 | 2,435,425 | 663,604 |
| Land Parking | 1 | 190,000 | 51,771 |
| Medical center | 1 | 6,700,000 | 1,825,613 |
| Villa | 207 | 68,113,279 | 18,559,477 |
| E) Virtual Unit | 136 | 16,470,429 | 4,487,855 |
| Office | 134 | 16,430,429 | 4,476,956 |
| Warehouse | 2 | 40,000 | 10,899 |
| Grand Total | 3270 | 634,213,499 | 172,810,218 |
Top 10 Localities by Value
| Locality | Number of Transactions | Value (AED) | Value (USD) |
|---|---|---|---|
| Al Goze Third | 129 | 58,683,950 | 15,990,177 |
| Trade Center Second | 15 | 50,015,199 | 13,628,120 |
| Al Khabeesi | 4 | 36,713,100 | 10,003,569 |
| Business Bay | 146 | 32,411,940 | 8,831,591 |
| Al Thanyah Fifth | 62 | 31,583,271 | 8,605,796 |
| Burj Khalifa | 60 | 29,785,292 | 8,115,883 |
| Dubai Investment Park Second | 56 | 27,329,134 | 7,446,631 |
| Al Merkadh | 35 | 24,726,325 | 6,737,418 |
| Al Barsha First | 65 | 18,384,133 | 5,009,301 |
| Um Hurair Second | 4 | 18,215,000 | 4,963,215 |
A further 135 localities recorded rental activity, with a combined value of AED 286,365,455. The next highest concentrations were observed in Al Hebiah First, Marsa Dubai, and Al Goze Fourth.
Conclusion
Renewals continued to dominate transaction volume, while new contracts accounted for a larger share of value. Residential units remained the primary driver of activity, supported by steady volumes across flats and villas.
Commercial leasing maintained a strong value contribution, particularly within office and retail-related unit types. Activity was distributed across a broad range of areas, with the highest concentrations clustered in established commercial and mixed-use districts.
Disclaimer
This report is based on publicly available market transaction summaries and compiled data related to Dubai real estate activity for the stated period.
Figures are presented for informational purposes only and may vary from final official statistics published by the Dubai Land Department (DLD).
1 US Dollar = 3.6725 UAE Dirhams
This material does not constitute financial or investment advice. Real estate investments involve risk and readers should conduct independent research before making any investment decisions.