Dubai Real Estate Rental Transactions - 17 March 2026
Dubai Rental Transactions
Registered Monday, 17 March 2026
On Tuesday, 17 March 2026, a total of 3,021 rental transactions were registered in Dubai, with a combined value of AED 822,112,543. Contract renewals accounted for the majority of activity by volume, while new contracts carried the larger share of total value.
Residential rentals represented most transactions by count, whereas commercial usage accounted for the bulk of value. Ownership distribution remained relatively balanced between freehold and non-freehold properties, with a higher value recorded under non-freehold.
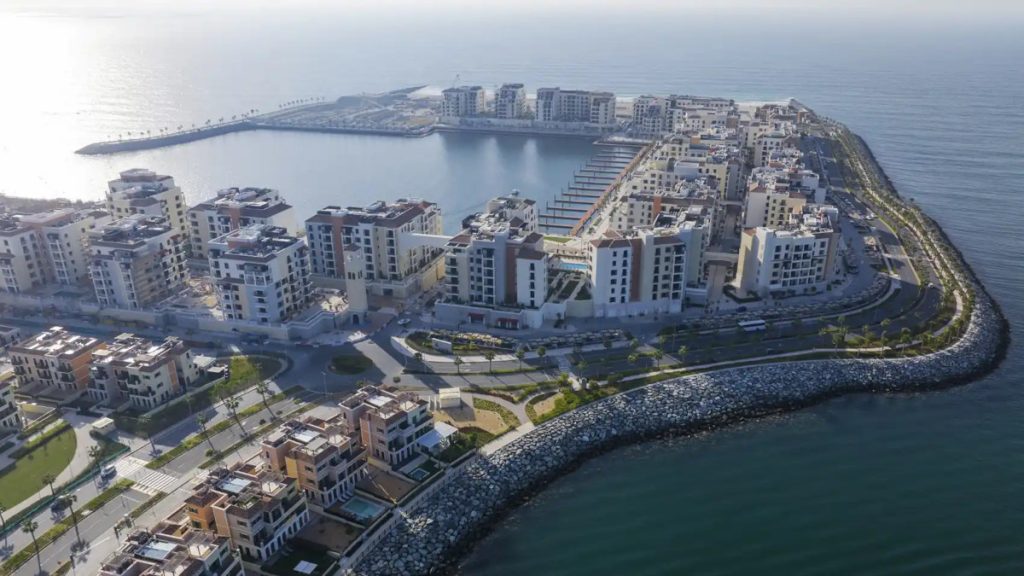
Solaya by Meraas Private Beachfront Residences at La Mer Beach, Dubai
Source: Building Arabia.
Transactions by Contract Type
| Category | Number of Transactions | Value (AED) | Value (USD) |
|---|---|---|---|
| New | 1067 | 537,942,248 | 146,578,269 |
| Renewed | 1954 | 284,170,295 | 77,430,598 |
| Grand Total | 3021 | 822,112,543 | 224,008,867 |
Transactions by Property Ownership Type
| Category | Number of Transactions | Value (AED) | Value (USD) |
|---|---|---|---|
| Free Hold | 1545 | 379,755,729 | 103,475,675 |
| Non Free Hold | 1476 | 442,356,814 | 120,533,192 |
| Grand Total | 3021 | 822,112,543 | 224,008,867 |
Transactions by Property Usage
| Category | Number of Transactions | Value (AED) | Value (USD) |
|---|---|---|---|
| Commercial | 818 | 559,488,804 | 152,449,265 |
| Educational facility | 1 | 966,492 | 263,349 |
| Industrial | 6 | 1,338,567 | 364,732 |
| Residential | 2186 | 259,153,203 | 70,613,952 |
| Storage | 2 | 320,000 | 87,193 |
| Other | 8 | 845,478 | 230,375 |
| Grand Total | 3021 | 822,112,543 | 224,008,867 |
Transactions by Property Type
| Category | Number of Transactions | Value (AED) | Value (USD) |
|---|---|---|---|
| A) Land | 6 | 743,978 | 202,719 |
| Other | 6 | 743,978 | 202,719 |
| B) Unit | 2684 | 771,989,722 | 210,351,423 |
| Building | 1 | 99,225 | 27,037 |
| Clinic | 1 | 315,000 | 85,831 |
| Complex Warehouse | 2 | 450,100 | 122,643 |
| Flat | 1861 | 156,451,495 | 42,629,835 |
| GYM | 1 | 130,000 | 35,422 |
| Hotel | 4 | 305,800 | 83,324 |
| Kiosk | 1 | 114,109 | 31,092 |
| Labor Camps | 121 | 62,277,200 | 16,969,264 |
| Ladies Saloon | 1 | 116,000 | 31,608 |
| Mezzanine | 1 | 28,750 | 7,834 |
| Office | 329 | 334,996,568 | 91,279,719 |
| Parking | 3 | 452,500 | 123,297 |
| School | 1 | 966,492 | 263,349 |
| Shop | 278 | 198,081,950 | 53,973,283 |
| Showroom | 6 | 7,854,181 | 2,140,104 |
| Store | 1 | 293,779 | 80,049 |
| Studio | 34 | 1,056,460 | 287,864 |
| Villa | 1 | 315,000 | 85,831 |
| Warehouse | 33 | 7,137,618 | 1,944,855 |
| Warehouse complex | 3 | 422,000 | 114,986 |
| Workshop | 1 | 125,496 | 34,195 |
| C) Villa | 180 | 45,040,573 | 12,272,636 |
| Clinic | 3 | 1,770,000 | 482,289 |
| Complex Villas | 15 | 6,247,624 | 1,702,350 |
| Shop | 1 | 30,000 | 8,174 |
| Showroom | 1 | 30,000 | 8,174 |
| Villa | 160 | 36,962,949 | 10,071,648 |
| D) Virtual Unit | 151 | 4,338,270 | 1,182,090 |
| Office | 150 | 4,194,630 | 1,142,951 |
| Shop | 1 | 143,640 | 39,139 |
| Grand Total | 3021 | 822,112,543 | 224,008,867 |
Top 10 Localities by Value
| Category | Number of Transactions | Value (AED) | Value (USD) |
|---|---|---|---|
| Oud Metha | 21 | 181,605,946 | 49,483,909 |
| Al Thanyah Fifth | 73 | 75,120,836 | 20,468,893 |
| Al Kheeran | 4 | 56,551,777 | 15,409,204 |
| Marsa Dubai | 45 | 46,657,429 | 12,713,196 |
| Business Bay | 106 | 46,267,999 | 12,607,084 |
| Al Khawaneej Second | 15 | 44,156,368 | 12,031,708 |
| Saih Shuaib 3 | 23 | 38,116,170 | 10,385,877 |
| Al Safouh Second | 11 | 12,631,303 | 3,441,772 |
| Palm Jumeirah | 17 | 12,470,809 | 3,398,041 |
| Burj Khalifa | 59 | 11,255,775 | 3,066,969 |
A further 137 localities recorded rental activity, with a combined transaction value of AED 297,278,131. Notable activity beyond the top tier included Al Goze Third, Al Barsha First, and Al Khairan First.
Renewed contracts accounted for the larger share of transactions, while new agreements contributed more in value terms. Residential properties dominated by volume, whereas commercial leases carried most of the capital value recorded.
Unit-based rentals, particularly offices and shops, represented the largest share of value within property types. Activity remained distributed across a wide range of areas, with higher-value concentrations in a limited number of localities.
Disclaimer
This report is based on publicly available market transaction summaries and compiled data related to Dubai real estate activity for the stated period.
Figures are presented for informational purposes only and may vary from final official statistics published by the Dubai Land Department (DLD).
1 US Dollar = 3.6725 UAE Dirhams
This material does not constitute financial or investment advice. Real estate investments involve risk and readers should conduct independent research before making any investment decisions.