Dubai Real Estate Rental Transactions: 28 - 30 March 2026
Dubai Real Estate Rental Transactions Report
Period: 28 – 30 March 2026
A total of 5,765 rental transactions were registered with a combined contract value of AED 12,754,929,612. Activity was heavily concentrated within new lease registrations, which accounted for the majority of total value despite fewer transactions than renewals.
The overall figures were materially influenced by activity in Al Mamzer, where 220 new residential unit leases were recorded at an annual rental value of AED 51,726,027 each, structured as a 12-month term with a 2-month grace period. This concentration significantly skewed total value distribution for the period.
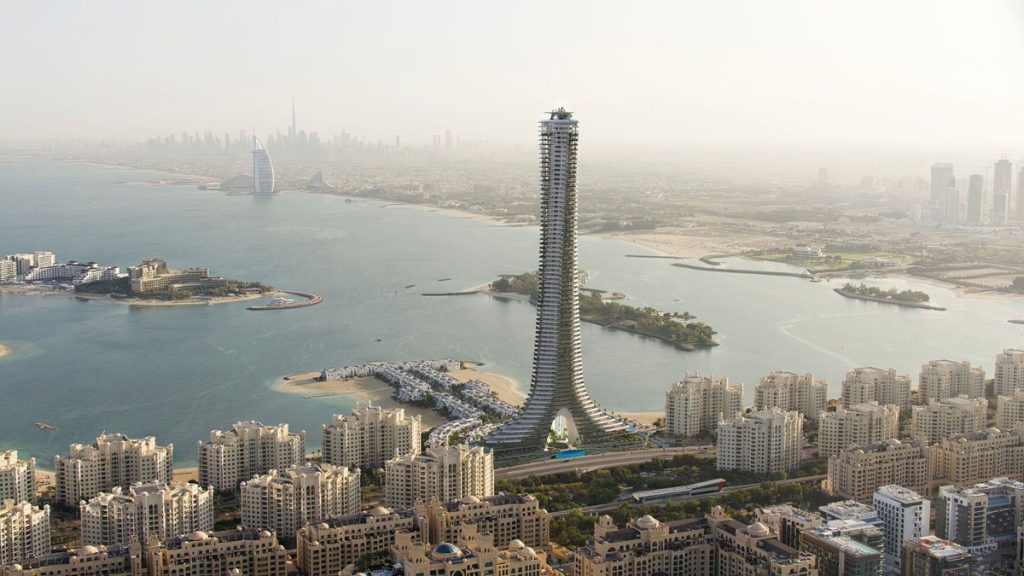
Como Residences rises on the Palm Jumeirah, Dubai
Source: Building Arabia.
Transactions by Contract Type
| Category | Number of Transactions | Value (AED) | Value (USD) |
|---|---|---|---|
| New | 2237 | 12,126,051,284 | 3,301,851,950 |
| Renewed | 3528 | 628,878,328 | 171,239,844 |
| Grand Total | 5765 | 12,754,929,612 | 3,473,091,794 |
Transactions by Property Ownership Type
| Category | Number of Transactions | Value (AED) | Value (USD) |
|---|---|---|---|
| Free Hold | 2698 | 858,433,809 | 233,746,442 |
| Non Free Hold | 3067 | 11,896,495,803 | 3,239,345,352 |
| Grand Total | 5765 | 12,754,929,612 | 3,473,091,794 |
Transactions by Property Usage
| Category | Number of Transactions | Value (AED) | Value (USD) |
|---|---|---|---|
| Commercial | 1291 | 806,141,483 | 219,507,552 |
| Industrial | 13 | 3,253,173 | 885,820 |
| Residential | 4444 | 11,941,961,197 | 3,251,725,309 |
| Other | 17 | 3,573,758 | 973,113 |
| Grand Total | 5765 | 12,754,929,612 | 3,473,091,794 |
Transactions by Property Type
| Category | Number of Transactions | Value (AED) | Value (USD) |
|---|---|---|---|
| A) Building | |||
| Warehouse | 1 | 100,000 | 27,229 |
| Subtotal | 1 | 100,000 | 27,229 |
| B) Land | |||
| Other | 14 | 3,462,258 | 942,752 |
| Subtotal | 14 | 3,462,258 | 942,752 |
| C) Unit | |||
| Complex Warehouse | 2 | 4,195,700 | 1,142,464 |
| Factory | 1 | 50,000 | 13,615 |
| Flat | 3694 | 11,671,590,397 | 3,178,104,941 |
| Hotel | 24 | 2,504,030 | 681,833 |
| Hotel apartments | 6 | 3,000,000 | 816,882 |
| Kiosk | 2 | 245,000 | 66,712 |
| Labor Camps | 405 | 180,639,612 | 49,187,096 |
| Mezzanine | 1 | 65,000 | 17,700 |
| Office | 580 | 668,526,964 | 182,035,933 |
| Open space | 3 | 745,696 | 203,049 |
| Parking | 3 | 880,000 | 239,619 |
| Penthouse | 1 | 1,700,000 | 462,900 |
| Shop | 419 | 105,130,089 | 28,626,301 |
| Showroom | 9 | 2,460,334 | 670,003 |
| Storage | 2 | 39,408 | 10,731 |
| Store | 4 | 283,000 | 77,059 |
| Studio | 42 | 1,451,827 | 395,324 |
| Villa | 1 | 210,000 | 57,183 |
| Warehouse | 41 | 9,765,485 | 2,659,084 |
| Warehouse complex | 2 | 363,387 | 98,948 |
| Workshop | 2 | 520,000 | 141,593 |
| Other | 3 | 291,075 | 79,258 |
| Subtotal | 5247 | 12,654,657,004 | 3,445,788,156 |
| D) Villa | |||
| Arabian House | 1 | 60,000 | 16,338 |
| Clinic | 1 | 500,000 | 136,147 |
| Complex Villas | 21 | 3,463,185 | 943,005 |
| Medical center | 1 | 180,000 | 49,013 |
| Shop | 2 | 100,000 | 27,229 |
| Villa | 284 | 83,452,754 | 22,723,691 |
| Subtotal | 310 | 87,755,939 | 23,895,422 |
| E) Virtual Unit | |||
| Office | 193 | 8,954,410 | 2,438,233 |
| Subtotal | 193 | 8,954,410 | 2,438,233 |
| Grand Total | 5765 | 12,754,929,612 | 3,473,091,794 |
Top 10 Localities by Value
| Locality | Number of Transactions | Value (AED) | Value (USD) |
|---|---|---|---|
| Al Mamzer | 238 | 11,380,850,940 | 3,098,938,309 |
| Trade Center First | 44 | 428,944,719 | 116,800,468 |
| Port Saeed | 64 | 171,001,717 | 46,562,755 |
| Dubai Investment Park Second | 94 | 52,054,068 | 14,174,014 |
| Muhaisanah Second | 98 | 47,373,895 | 12,899,631 |
| Jabal Ali Industrial First | 85 | 39,806,846 | 10,839,168 |
| Nadd Hessa | 121 | 29,836,395 | 8,124,274 |
| Business Bay | 234 | 29,699,815 | 8,087,084 |
| Palm Jumeirah | 18 | 25,134,299 | 6,843,921 |
| Marsa Dubai | 94 | 23,995,518 | 6,533,837 |
A total of 135 other localities recorded activity during the period, with a combined value of AED 546,631,915. Notable activity beyond the top tier included Trade Center Second, Al Baraha, and Burj Khalifa.
Conclusion
Transaction volume remained weighted toward renewals, while value concentration was driven by new contracts. Non Free Hold properties accounted for the majority of total value across the reporting period.
Residential usage and unit-based properties dominated both volume and value, with flats representing the largest share of recorded transactions. The concentration observed in Al Mamzer materially influenced the overall distribution of rental values during the period.
Disclaimer
This report is based on publicly available market transaction summaries and compiled data related to Dubai real estate activity for the stated period.
Figures are presented for informational purposes only and may vary from final official statistics published by the Dubai Land Department (DLD).
1 US Dollar = 3.6725 UAE Dirhams
This material does not constitute financial or investment advice. Real estate investments involve risk and readers should conduct independent research before making any investment decisions.