Dubai Real Estate Rental Transactions Report 01 - 07 March 2026
Dubai Real Estate Rental Market Report
01 – 07 March 2026
During the first week of March 2026, Dubai registered 19,073 rental transactions with a combined value of AED 18,611,603,491. Activity covered new and renewed lease contracts across residential, commercial, industrial, and specialized property categories, recorded in both freehold and non-freehold areas.
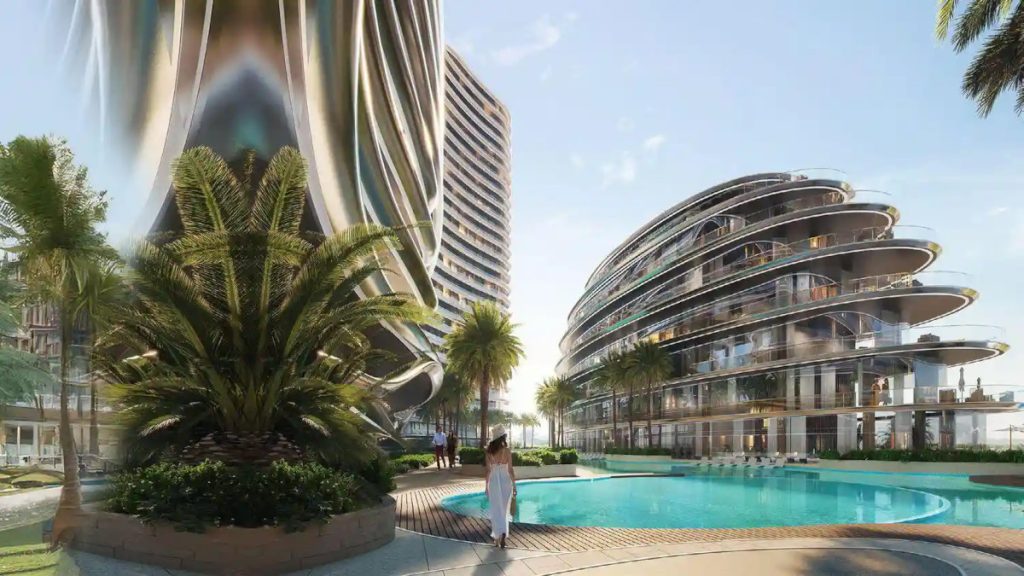
Aquarise by Binghatti – Luxury Waterfront Living in Business Bay - Dubai
Source: Building Arabia.
Transactions by Contract Type
| Contract Type | Number of Transactions | Value (AED) | Value (USD) |
|---|---|---|---|
| New | 7969 | 7,749,582,233 | 2,110,165,346 |
| Renewed | 11104 | 10,862,021,257 | 2,957,664,059 |
| Grand Total | 19073 | 18,611,603,491 | 5,067,829,405 |
Transactions by Property Ownership Type
| Property Ownership Type | Number of Transactions | Value (AED) | Value (USD) |
|---|---|---|---|
| Free Hold | 8826 | 5,523,758,394 | 1,504,086,697 |
| Non Free Hold | 10247 | 13,087,845,096 | 3,563,742,708 |
| Grand Total | 19073 | 18,611,603,491 | 5,067,829,405 |
Transactions by Property Usage
| Property Usage | Number of Transactions | Value (AED) | Value (USD) |
|---|---|---|---|
| Commercial | 4495 | 5,025,165,627 | 1,368,321,478 |
| Educational facility | 1 | 17,000 | 4,629 |
| Health Facility | 2 | 3,720,000 | 1,012,934 |
| Industrial | 30 | 10,495,381 | 2,857,830 |
| Residential | 14470 | 13,555,818,711 | 3,691,169,152 |
| Storage | 5 | 441,526 | 120,225 |
| Other | 70 | 15,945,245 | 4,341,796 |
| Grand Total | 19073 | 18,611,603,491 | 5,067,829,405 |
Transactions by Property Type
| Property Type / Subtype | Number of Transactions | Value (AED) | Value (USD) |
|---|---|---|---|
| A) Land | |||
| Other | 54 | 11,259,545 | 3,065,907 |
| B) Unit | |||
| Building | 2 | 143,000 | 38,938 |
| Car Wash | 2 | 1,000,000 | 272,294 |
| Clinic | 3 | 196,300 | 53,451 |
| Factory | 3 | 3,398,318 | 925,342 |
| Flat | 11080 | 8,870,887,991 | 2,415,490,401 |
| GYM | 3 | 1,574,500 | 428,727 |
| Health club | 2 | 273,200 | 74,391 |
| Hotel | 128 | 54,956,068 | 14,964,212 |
| Hotel apartments | 4 | 420,000 | 114,364 |
| Kiosk | 4 | 1,393,760 | 379,513 |
| Labor Camps | 2213 | 4,417,728,559 | 1,202,921,323 |
| Ladies Saloon | 5 | 524,690 | 142,870 |
| Medical center | 1 | 3,700,000 | 1,007,488 |
| Mezzanine | 7 | 938,550 | 255,562 |
| Office | 1882 | 4,005,939,736 | 1,090,793,665 |
| Open space | 2 | 846,240 | 230,426 |
| Parking | 7 | 1,469,772 | 400,210 |
| Restaurant | 13 | 6,133,608 | 1,670,145 |
| Resturants Complex | 1 | 280,000 | 76,242 |
| Shop | 1439 | 592,696,457 | 161,387,599 |
| Showroom | 60 | 61,894,844 | 16,853,599 |
| Sign Board | 2 | 3,090,000 | 841,389 |
| Staff Accommodation | 12 | 5,177,236 | 1,409,731 |
| Storage | 1 | 95,000 | 25,868 |
| Store | 12 | 2,371,535 | 645,755 |
| Studio | 153 | 93,148,135 | 25,363,686 |
| Supermarket | 1 | 800,417 | 217,949 |
| Supermarket, a multi-section | 2 | 435,068 | 118,466 |
| Villa | 1 | 85,000 | 23,145 |
| Warehouse | 162 | 103,049,458 | 28,059,757 |
| Warehouse complex | 9 | 2,314,500 | 630,225 |
| Workshop | 16 | 2,408,657 | 655,863 |
| Other | 3 | 3,801,600 | 1,035,153 |
| C) Villa | |||
| Clinic | 3 | 1,185,000 | 322,668 |
| Complex Villas | 102 | 18,627,002 | 5,072,022 |
| Medical center | 4 | 1,580,000 | 430,225 |
| Shop | 4 | 432,500 | 117,767 |
| Studio | 1 | 42,000 | 11,436 |
| Villa | 950 | 240,753,638 | 65,555,790 |
| Other | 1 | 225,000 | 61,266 |
| D) Virtual Unit | |||
| Office | 706 | 59,057,151 | 16,080,912 |
| Shop | 11 | 35,224,456 | 9,591,411 |
| Warehouse | 2 | 45,000 | 12,253 |
| Grand Total | 19073 | 18,611,603,491 | 5,067,829,405 |
Top 10 Localities by Value
| Locality | Number of Transactions | Value (AED) | Value (USD) |
|---|---|---|---|
| Trade Center First | 524 | 6,905,227,862 | 1,880,252,651 |
| Nadd Hessa | 360 | 3,609,621,344 | 982,878,514 |
| Jabal Ali Industrial First | 698 | 1,678,074,747 | 456,929,815 |
| Al Goze Industrial First | 226 | 1,250,761,683 | 340,574,999 |
| Ras Al Khor Industrial Third | 240 | 884,219,056 | 240,767,612 |
| Muhaisanah Second | 435 | 549,280,038 | 149,565,701 |
| Al Ttay | 164 | 381,428,400 | 103,860,694 |
| Al Goze Third | 397 | 325,927,314 | 88,748,077 |
| Dubai Investment Park First | 641 | 295,598,420 | 80,489,699 |
| Burj Khalifa | 320 | 233,733,250 | 63,644,180 |
Rental transactions were also recorded in 162 other active localities totaling AED 6,497,731,377, including areas such as Palm Jumeirah, Madinat Dubai Almelaheyah, Dubai Investment Park Second, Business Bay, and Al Barsha South Fourth..
Conclusion
During the period from 01 to 07 March 2026, the Dubai rental registry recorded 19,073 lease transactions totaling AED 18.61 billion. Renewed contracts represented the majority of registrations with 11,104 transactions, while 7,969 new contracts were recorded. Residential properties accounted for the largest share of activity with 14,470 transactions, followed by 4,495 commercial leases.
At the property type level, Unit rentals dominated the registry activity, particularly flats with 11,080 transactions, alongside significant activity in labor camps and office leases. In terms of geographic distribution, Trade Center First recorded the highest transaction value, followed by Nadd Hessa and Jabal Ali Industrial First, indicating strong leasing activity across both central business districts and industrial zones.
Disclaimer
This report is based on publicly available market transaction summaries and compiled data related to Dubai real estate activity for the stated period.
Figures are presented for informational purposes only and may vary from final official statistics published by the Dubai Land Department (DLD).
1 US Dollar = 3.6725 UAE Dirhams
This material does not constitute financial or investment advice. Real estate investments involve risk and readers should conduct independent research before making any investment decisions.