Dubai Real Estate Rentals Market Report 19 February 2026
Dubai Real Estate Rental Transactions Report
Thursday, 19 February 2026
Market Review
A total of 4,291 real estate rental transactions were registered in Dubai on Thursday, 19 February 2026, with a combined value of AED 2,985,331,920. The registrations covered new and renewed contracts across freehold and non-freehold properties, spanning residential, commercial, industrial, and other specified property uses.
Rental activity was recorded across multiple property structures, including buildings, land, units, villas, and virtual units. Transactions were geographically distributed across a wide range of localities, with varying concentrations of value and volume.
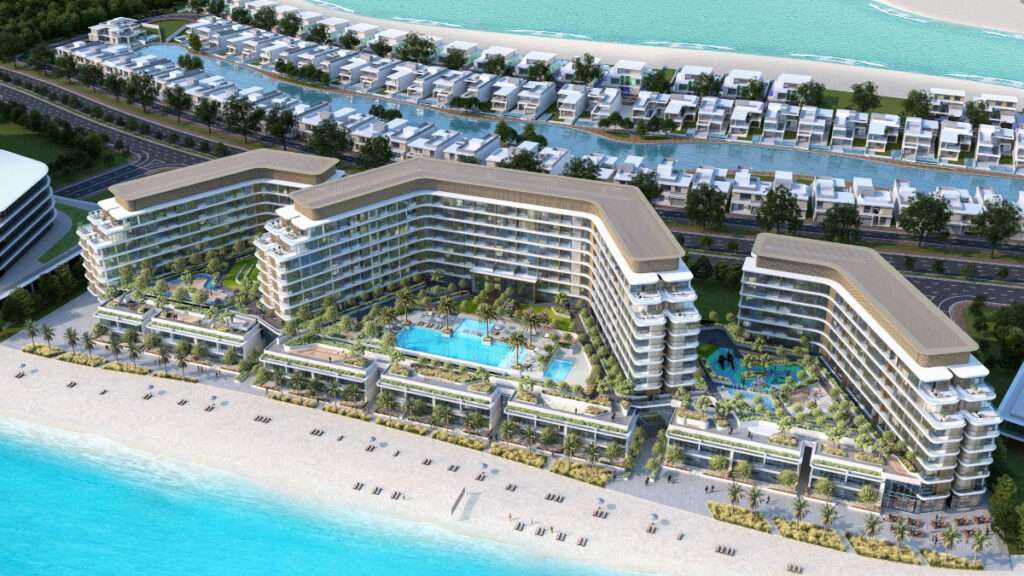
Siniya Island: The Ultimate Island Escape in the UAE
Source: Building Arabia.
Transaction Breakdown
By Contract Type
| Contract Type | Number of Transactions | Value (AED) | Value (USD) |
|---|---|---|---|
| New | 1,722 | 1,786,854,716 | 486,560,539 |
| Renewed | 2,569 | 1,198,477,204 | 326,345,343 |
| Grand Total | 4,291 | 2,985,331,920 | 812,905,882 |
By Property Ownership Type
| Ownership Type | Number of Transactions | Value (AED) | Value (USD) |
|---|---|---|---|
| Free Hold | 2,002 | 1,667,196,815 | 453,977,693 |
| Non Free Hold | 2,289 | 1,318,135,105 | 358,928,189 |
| Grand Total | 4,291 | 2,985,331,920 | 812,905,882 |
By Property Usage
| Property Usage | Number of Transactions | Value (AED) | Value (USD) |
|---|---|---|---|
| Commercial | 1,047 | 847,472,903 | 230,766,872 |
| Educational facility | 2 | 11,001,000 | 2,995,572 |
| Health Facility | 5 | 4,157,580 | 1,132,109 |
| Industrial | 18 | 13,756,112 | 3,745,789 |
| Residential | 3,213 | 2,107,844,633 | 573,966,093 |
| Storage | 1 | 141,680 | 38,579 |
| Other | 5 | 958,011 | 260,866 |
| Grand Total | 4,291 | 2,985,331,920 | 812,905,882 |
Property Type Breakdown
| Property Type | Number of Transactions | Value (AED) | Value (USD) |
|---|---|---|---|
| A) Building | |||
| School | 2 | 11,001,000 | 2,995,572 |
| B) Land | |||
| Other | 4 | 916,011 | 249,430 |
| C) Unit | |||
| Clinic | 8 | 4,337,580 | 1,181,123 |
| Flat | 2,249 | 278,255,869 | 75,769,073 |
| Hotel | 185 | 512,008,984 | 139,420,046 |
| Kiosk | 1 | 66,000 | 17,972 |
| Labor Camps | 727 | 1,774,924,276 | 483,311,880 |
| Mezzanine | 3 | 140,000 | 38,122 |
| Office | 336 | 220,538,923 | 60,052,749 |
| Open Land | 2 | 1,600,000 | 435,680 |
| Parking | 6 | 1,674,001 | 455,830 |
| Restaurant | 1 | 97,750 | 26,617 |
| Shop | 267 | 55,974,049 | 15,241,733 |
| Showroom | 8 | 4,511,943 | 1,228,602 |
| Store | 2 | 167,600 | 45,637 |
| Studio | 24 | 837,496 | 228,050 |
| Villa | 1 | 50,000 | 13,615 |
| Warehouse | 60 | 35,454,604 | 9,654,289 |
| Warehouse complex | 2 | 240,000 | 65,352 |
| Workshop | 1 | 529,200 | 144,101 |
| Other | 4 | 306,000 | 83,324 |
| D) Villa | |||
| Clinic | 2 | 912,558 | 248,490 |
| Complex Villas | 14 | 3,612,198 | 983,602 |
| Restaurant | 1 | 2,250,000 | 612,675 |
| Shop | 2 | 1,100,000 | 299,530 |
| Villa | 195 | 49,900,794 | 13,587,986 |
| E) Virtual Unit | |||
| Office | 181 | 6,450,236 | 1,756,399 |
| Shop | 3 | 17,474,849 | 4,758,401 |
| Grand Total | 4,291 | 2,985,331,920 | 812,905,882 |
Locality Analysis
Top 10 Localities by Value
| Locality | Number of Transactions | Value (AED) | Value (USD) |
|---|---|---|---|
| Jabal Ali Industrial First | 351 | 1,457,998,242 | 397,012,921 |
| Al Muteena | 180 | 506,559,798 | 137,936,233 |
| Saih Shuaib 4 | 361 | 374,371,140 | 101,941,261 |
| Saih Shuaib 2 | 40 | 148,531,217 | 40,445,051 |
| Burj Khalifa | 85 | 35,640,866 | 9,705,008 |
| Al Goze Fourth | 39 | 29,630,146 | 8,068,289 |
| Business Bay | 188 | 28,174,051 | 7,671,794 |
| Al Karama | 109 | 22,349,945 | 6,085,890 |
| Al Safouh Second | 20 | 20,900,157 | 5,691,113 |
| Al Barshaa South Third | 38 | 17,595,641 | 4,791,293 |
Other Active Localities:
Rental contracts were recorded in 149 additional localities, totaling AED 343,179,717, including activity in Marsa Dubai, Jumeirah First, Dubai Investment Park First, Dubai Investment Park Second, and Jabal Ali First.
Conclusion
The rental registrations recorded on 19 February 2026 covered a broad range of property usages, ownership structures, and property types, with activity distributed across industrial, residential, commercial, and specialized segments. Transactions were registered across buildings, land, units, villas, and virtual units, reflecting the structural diversity of Dubai’s rental market.
Disclaimer:
This report is based on publicly available data and Dubai Land Department (DLD) transaction summaries as of the date mentioned in the title of this post.
Final and detailed figures from the DLD may vary upon official release.
1 US Dollar = 3.6725 UAE Dirhams
This report is merely informative, and all investments come with risk. You are responsible for your decisions.