Dubai Real Estate Rentals Market Report 20 February 2026
Dubai Real Estate Rental Transactions Report | 20 February 2026
Market Review
A total of 3,382 real estate rental transactions were registered in Dubai on Friday, 20 February 2026, with a combined value of AED 1,971,205,126. Transactions were recorded across new and renewed lease contracts, spanning freehold and non-freehold ownership areas, and covering residential, commercial, industrial, and other property usages.
Rental activity was distributed across multiple property categories, including land, units, villas, and virtual units, with leasing recorded in a wide range of localities throughout the emirate. High-value rental registrations were concentrated in a limited number of industrial and mixed-use areas, while leasing activity was also observed across numerous residential districts.
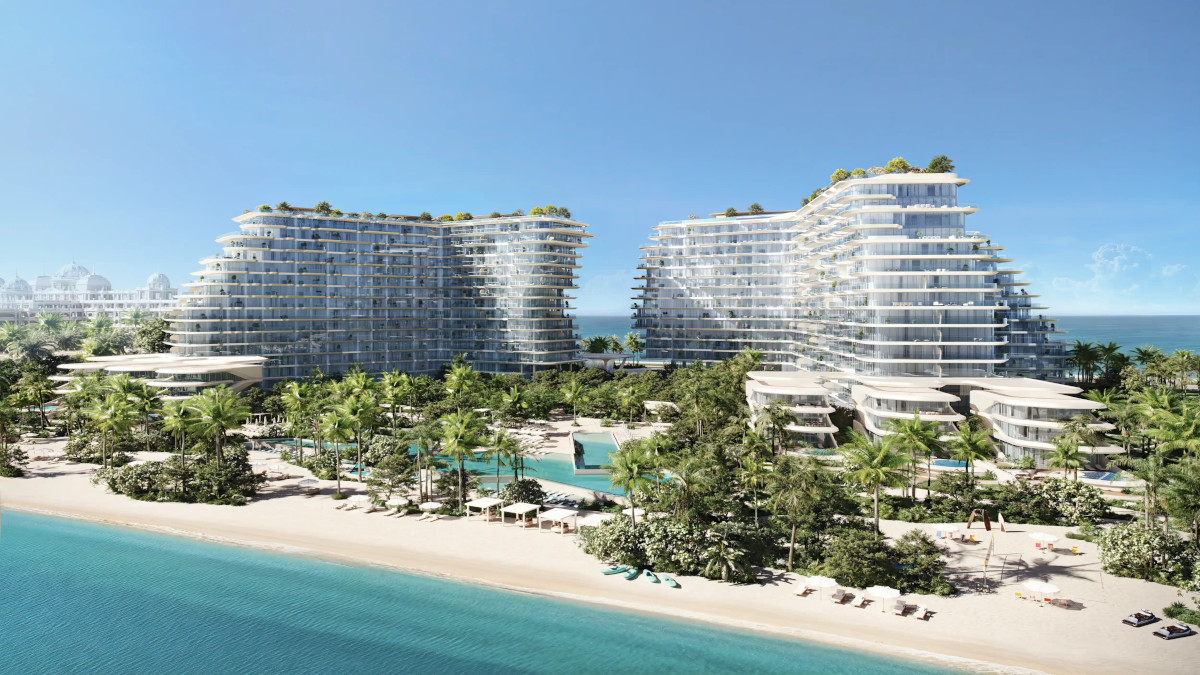
PASSO: The Final Beachfront Retreat on Palm Jumeirah
Source: Building Arabia.
Transaction Summary
By Contract Type
| Row Labels | Number of Transactions | Value (AED) | Value (USD) |
|---|---|---|---|
| New | 1,564 | 1,457,870,363 | 396,978,100 |
| Renewed | 1,818 | 513,334,763 | 139,781,056 |
| Grand Total | 3,382 | 1,971,205,126 | 536,759,156 |
By Property Ownership Type
| Row Labels | Number of Transactions | Value (AED) | Value (USD) |
|---|---|---|---|
| Free Hold | 1,591 | 248,755,507 | 67,736,324 |
| Non Free Hold | 1,791 | 1,722,449,619 | 469,022,831 |
| Grand Total | 3,382 | 1,971,205,126 | 536,759,156 |
By Property Usage
| Row Labels | Number of Transactions | Value (AED) | Value (USD) |
|---|---|---|---|
| Commercial | 814 | 525,948,523 | 143,215,783 |
| Industrial | 16 | 6,621,956 | 1,803,159 |
| Residential | 2,541 | 1,436,447,516 | 391,144,658 |
| Storage | 4 | 1,167,296 | 317,855 |
| Other | 7 | 1,019,834 | 277,701 |
| Grand Total | 3,382 | 1,971,205,126 | 536,759,156 |
Property Type Breakdown
| Row Labels | Number of Transactions | Value (AED) | Value (USD) |
|---|---|---|---|
| A) Land | |||
| Other | 5 | 935,939 | 254,856 |
| B) Unit | |||
| Building | 1 | 24,768 | 6,744 |
| Complex Warehouse | 4 | 125,177 | 34,086 |
| Flat | 1,770 | 141,421,085 | 38,508,961 |
| Health club | 1 | 57,000 | 15,521 |
| Hotel | 122 | 220,558,800 | 60,058,161 |
| Kiosk | 3 | 245,065 | 66,731 |
| Labor Camps | 584 | 1,258,262,837 | 342,624,970 |
| Office | 276 | 201,687,467 | 54,919,497 |
| Open space | 1 | 30,000 | 8,169 |
| Parking | 1 | 900,000 | 245,070 |
| Shop | 218 | 55,388,550 | 15,082,302 |
| Showroom | 9 | 9,635,507 | 2,623,748 |
| Store | 11 | 2,163,090 | 589,009 |
| Studio | 19 | 686,281 | 186,874 |
| Supermarket | 1 | 171,600 | 46,727 |
| Warehouse | 27 | 8,737,361 | 2,379,184 |
| Warehouse complex | 4 | 524,869 | 142,922 |
| Workshop | 5 | 1,331,530 | 362,576 |
| Other | 3 | 340,000 | 92,582 |
| C) Villa | |||
| Complex Villas | 14 | 2,855,277 | 777,492 |
| Villa | 160 | 42,817,354 | 11,659,165 |
| D) Virtual Unit | |||
| Office | 142 | 21,749,968 | 5,922,516 |
| Shop | 1 | 555,600 | 151,290 |
| Grand Total | 3,382 | 1,971,205,126 | 536,759,156 |
Locality Breakdown
Top 10 Localities by Transaction Value
| Locality | Number of Transactions | Value (AED) | Value (USD) |
|---|---|---|---|
| Jabal Ali Industrial First | 222 | 512,448,230 | 139,539,653 |
| Saih Shuaib 4 | 91 | 505,759,070 | 137,718,195 |
| Al Murqabat | 125 | 217,767,776 | 59,298,165 |
| Al Goze Third | 115 | 125,318,560 | 34,124,244 |
| Trade Center Second | 8 | 114,033,403 | 31,051,295 |
| Al Goze Fourth | 48 | 68,405,590 | 18,626,842 |
| Saih Shuaib 3 | 62 | 42,878,120 | 11,675,712 |
| Cornich Deira | 6 | 30,880,320 | 8,408,711 |
| Business Bay | 168 | 28,721,181 | 7,820,777 |
| Al Hebiah Second | 10 | 18,195,455 | 4,954,622 |
Other Active Localities:
Lease contracts were recorded in 142 additional localities, totaling AED 372,597,421 (USD 101,458,277), including areas such as Port Saeed, Burj Khalifa, Al Warsan First, Marsa Dubai, and Jumeirah Third.
Conclusion
Rental registrations on 20 February 2026 reflect activity across a wide range of contract types, ownership structures, property usages, and asset categories. Units accounted for the majority of rental transactions and value, with labor camps, flats, and offices representing the largest subtypes by value.
Geographically, rental value was concentrated in a limited number of industrial and mixed-use localities, while leasing activity was also distributed across numerous residential and commercial districts throughout Dubai.
Disclaimer:
This report is based on publicly available data and Dubai Land Department (DLD) transaction summaries as of the date mentioned in the title of this post.
Final and detailed figures from the DLD may vary upon official release.
1 US Dollar = 3.6725 UAE Dirhams
This report is merely informative, and all investments come with risk. You are responsible for your decisions.