Dubai Real Estate Sales Market Report 10 February 2026
Dubai Real Estate Sales Transactions Report — 10 February 2026
Market review
Dubai registered 1,403 sales transactions on 10 February 2026 with a combined value of AED 4,155,092,679 (USD 1,131,431,736). Ready (secondary-market) assets accounted for a larger share of the day’s value than off-plan stock, while Free Hold ownership captured the vast majority of capital transacted. Residential activity dominated volume; however, commercial land sales supplied a significant portion of the aggregate value.
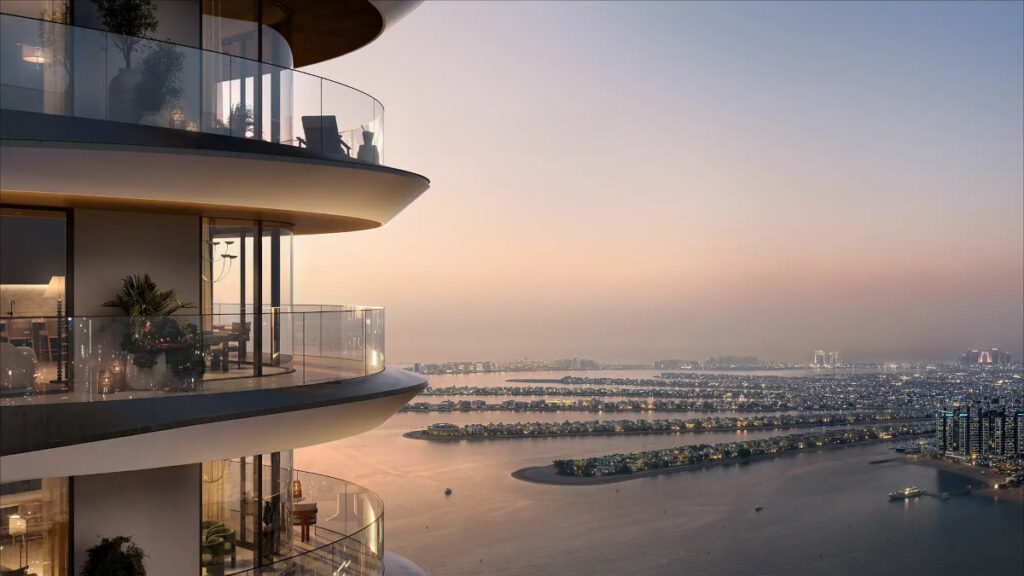
The Bristol Emaar Beachfront Branded Luxury Residences at Dubai Harbour
Source: Building Arabia.
Transaction tables
By Sales Type
| Row Labels | Number of Transactions | Value (AED) | Value (USD) |
|---|---|---|---|
| Gifts | 28 | 75,238,700 | 20,487,498 |
| Mortgage | 182 | 409,551,663 | 111,520,918 |
| Sales | 1,193 | 3,670,302,315 | 999,423,321 |
| Grand Total | 1,403 | 4,155,092,679 | 1,131,431,736 |
By Property Status
| Row Labels | Number of Transactions | Value (AED) | Value (USD) |
|---|---|---|---|
| Off-Plan | 801 | 1,806,631,955 | 491,945,881 |
| Ready | 602 | 2,348,460,723 | 639,485,855 |
| Grand Total | 1,403 | 4,155,092,679 | 1,131,431,736 |
By Property Ownership Type
| Row Labels | Number of Transactions | Value (AED) | Value (USD) |
|---|---|---|---|
| Free Hold | 1,325 | 3,947,026,529 | 1,074,775,324 |
| Non Free Hold | 78 | 208,066,150 | 56,656,413 |
| Grand Total | 1,403 | 4,155,092,679 | 1,131,431,736 |
By Property Usage
| Row Labels | Number of Transactions | Value (AED) | Value (USD) |
|---|---|---|---|
| Commercial | 98 | 1,073,599,045 | 292,340,820 |
| Residential | 1,305 | 3,081,493,633 | 839,090,716 |
| Grand Total | 1,403 | 4,155,092,679 | 1,131,431,736 |
By Property Type
| Property Type | Number of Transactions | Value (AED) | Value (USD) |
|---|---|---|---|
| A) Building | 143 | 480,018,137 | 130,708,939 |
| Villa | 143 | 480,018,137 | 130,708,939 |
| B) Land | 181 | 1,586,629,535 | 432,039,222 |
| Commercial | 97 | 1,069,939,045 | 291,344,402 |
| General Use | 6 | 87,016,338 | 23,694,549 |
| Government Housing | 3 | 8,000,000 | 2,178,400 |
| Industrial | 1 | 3,660,000 | 996,618 |
| Land | 4 | 20,339,998 | 5,538,581 |
| Residential | 47 | 270,715,095 | 73,715,720 |
| Residential Flats | 3 | 26,800,000 | 7,297,640 |
| Other | 20 | 100,159,058 | 27,273,311 |
| D) Unit | 1,079 | 2,088,445,007 | 568,683,575 |
| Flat | 1,006 | 1,869,695,098 | 509,118,175 |
| Hotel Apartment | 19 | 35,427,027 | 9,646,779 |
| Hotel Rooms | 6 | 6,684,314 | 1,820,139 |
| Office | 42 | 118,427,573 | 32,247,828 |
| Shop | 6 | 58,210,995 | 15,850,854 |
| Grand Total | 1,403 | 4,155,092,679 | 1,131,431,736 |
By Locality — Top 10 by Value
| Rank | Locality | Number of Transactions | Value (AED) | Value (USD) |
|---|---|---|---|---|
| 1 | Warsan Fourth | 76 | 806,412,473 | 219,586,116 |
| 2 | Al Yelayiss 1 | 84 | 286,843,320 | 78,107,436 |
| 3 | BUSINESS BAY | 69 | 142,665,157 | 38,847,722 |
| 4 | Madinat Al Mataar | 79 | 142,409,102 | 38,778,000 |
| 5 | Hadaeq Sheikh Mohammed Bin Rashid | 43 | 116,837,537 | 31,814,861 |
| 6 | PALM JUMEIRAH | 9 | 106,561,419 | 29,016,674 |
| 7 | Palm Deira | 31 | 96,572,759 | 26,296,762 |
| 8 | BUSINESS PARK | 58 | 91,843,658 | 25,009,028 |
| 9 | Al Wasl | 21 | 90,534,000 | 24,652,408 |
| 10 | Me'Aisem Second | 6 | 87,016,338 | 23,694,549 |
Subtotal (Top 10): 476 transactions — AED 1,967,695,763 | USD 535,803,556.
Transactions were also recorded in 117 other active localities, totalling AED 2,187,396,916 (USD 595,628,180) — examples include DUBAI LAND RESIDENCE COMPLEX, JUMEIRAH VILLAGE CIRCLE, SOBHA HEARTLAND, DUBAI HILLS and Dubai Investment Park Second.
Conclusion
Activity on 10 February 2026 was concentrated in residential volume (flats and villas) while the largest value contribution came from land and ready assets in key localities — Warsan Fourth and Al Yelayiss 1 led by value. Free Hold properties accounted for the dominant share of capital transacted.
The day’s data also highlights geographic concentration: the top 10 localities contributed a material portion of daily value while the remainder was spread across 117 additional localities.
Disclaimer:
This report is based on publicly available data and Dubai Land Department (DLD) transaction summaries as of the date mentioned in the title of this post.
Final and detailed figures from the DLD may vary upon official release.
1 US Dollar = 3.6725 UAE Dirhams
This report is merely informative, and all investments come with risk. You are responsible for your decisions.