Dubai Real Estate Sales Market Report 21 - 23 February 2026
Dubai Real Estate Market Statistics
Weekend Transactions: 21–23 February 2026
General Market Review
During the period 21–23 February 2026, Dubai recorded 1,088 real estate transactions with a combined value of AED 3,421,400,283. Transaction activity was primarily driven by outright Sales contracts, Free Hold ownership, and Residential usage. While Off-Plan properties accounted for the majority of transaction volume, Ready properties represented the larger share of total value.
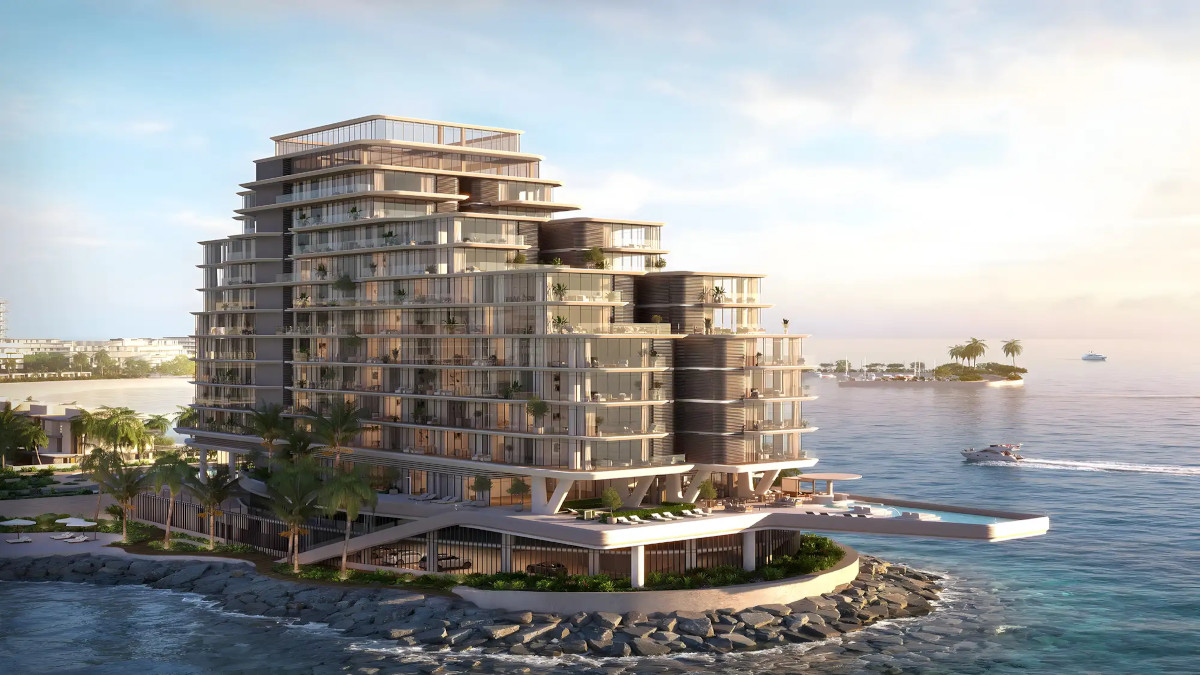
Ultimate Waterfront Living at Anantara Residences, Mina RAK
Source: Building Arabia.
Transactions by Sales Type
| Sales Type | Number of Transactions | Value (AED) | Value (USD) |
|---|---|---|---|
| Gifts | 35 | 96,974,906 | 26,423,680 |
| Mortgage | 144 | 425,880,340 | 116,043,689 |
| Sales | 909 | 2,898,545,037 | 789,794,288 |
| Grand Total | 1,088 | 3,421,400,283 | 932,261,657 |
Transactions by Property Status
| Property Status | Number of Transactions | Value (AED) | Value (USD) |
|---|---|---|---|
| Off-Plan | 621 | 1,411,533,636 | 384,614,069 |
| Ready | 467 | 2,009,866,647 | 547,647,588 |
| Grand Total | 1,088 | 3,421,400,283 | 932,261,657 |
Transactions by Property Ownership Type
| Ownership Type | Number of Transactions | Value (AED) | Value (USD) |
|---|---|---|---|
| Free Hold | 1,068 | 3,332,874,757 | 908,140,261 |
| Non Free Hold | 20 | 88,525,526 | 24,121,397 |
| Grand Total | 1,088 | 3,421,400,283 | 932,261,657 |
Transactions by Property Usage
| Property Usage | Number of Transactions | Value (AED) | Value (USD) |
|---|---|---|---|
| Commercial | 66 | 840,556,686 | 229,034,519 |
| Residential | 1,022 | 2,580,843,597 | 703,227,138 |
| Grand Total | 1,088 | 3,421,400,283 | 932,261,657 |
Transactions by Property Type
| Property Type / Subtype | Number of Transactions | Value (AED) | Value (USD) |
|---|---|---|---|
| A) Building | |||
| Villa | 79 | 255,857,217 | 69,715,863 |
| B) Land | |||
| Airport | 1 | 6,100,000 | 1,662,125 |
| Commercial | 62 | 741,221,359 | 202,000,370 |
| General Use | 4 | 54,716,776 | 14,909,203 |
| Government Housing | 3 | 59,546,086 | 16,225,092 |
| Industrial | 3 | 93,335,327 | 25,431,969 |
| Labor Camp | 1 | 6,000,000 | 1,634,877 |
| Land | 3 | 39,756,016 | 10,832,702 |
| Residential | 40 | 300,110,490 | 81,774,000 |
| Residential / Residential Villa | 3 | 3,550,000 | 967,302 |
| Residential Flats | 3 | 56,195,645 | 15,312,165 |
| Unit | 1 | 45,000,000 | 12,261,580 |
| Other | 8 | 26,954,081 | 7,344,436 |
| C) Unit | |||
| Flat | 835 | 1,611,707,320 | 439,157,308 |
| Hotel Apartment | 4 | 12,054,672 | 3,284,652 |
| Hotel Rooms | 3 | 2,182,986 | 594,819 |
| Office | 24 | 70,168,308 | 19,119,430 |
| Shop | 8 | 30,294,001 | 8,254,496 |
| Stacked Townhouses | 2 | 3,200,000 | 871,935 |
| Warehouse | 1 | 3,450,000 | 940,054 |
| Grand Total | 1,088 | 3,421,400,283 | 932,261,657 |
Transactions by Locality
Top 10 Localities by Transaction Value
| Locality | Number of Transactions | Value (AED) | Value (USD) |
|---|---|---|---|
| Al Yelayiss 5 | 43 | 359,298,614 | 97,901,530 |
| Palm Jumeirah | 15 | 179,586,602 | 48,933,679 |
| Wadi Al Safa 5 | 44 | 161,502,192 | 44,006,047 |
| Palm Deira | 14 | 138,426,325 | 37,718,345 |
| Madinat Al Mataar | 55 | 130,140,792 | 35,460,706 |
| Al Wasl | 17 | 122,651,919 | 33,420,141 |
| Dubai Hills | 9 | 121,085,645 | 32,993,364 |
| Business Park | 57 | 102,197,112 | 27,846,625 |
| Al Barari | 8 | 101,979,844 | 27,787,423 |
| Wadi Al Safa 3 | 8 | 99,591,486 | 27,136,645 |
Activity was also recorded across 96 additional localities, contributing a combined AED 2,004,939,752. Among the next highest-value contributors were Al Yelayiss 1, Jumeirah Village Circle, Business Bay, Burj Khalifa, and Dubai Industrial City.
Conclusion
The reporting period shows a market dominated by Free Hold residential unit transactions, with Flats accounting for the bulk of volume, while Land transactions—particularly Commercial and Residential land—carried significant capital weight. Despite higher Off-Plan activity by count, Ready properties represented the larger share of total value.
Geographically, transaction value remained concentrated in a limited number of localities, led by Al Yelayiss 5, while transaction activity was broadly distributed across more than ninety additional areas, indicating wide market participation rather than reliance on a single development corridor.
Disclaimer:
This report is based on publicly available data and Dubai Land Department (DLD) transaction summaries as of the date mentioned in the title of this post.
Final and detailed figures from the DLD may vary upon official release.
1 US Dollar = 3.6725 UAE Dirhams
This report is merely informative, and all investments come with risk. You are responsible for your decisions.