Dubai Real Estate Sales Transactions - YTD: 01 January – 28 March 2026
Dubai Real Estate Transaction Report
Year-to-Date: 01 January – 28 March 2026
A total of 59,690 real estate transactions were recorded during the period, with an aggregate value of AED 245,843,580,098 (USD 66,941,750,878).
Transaction activity was led by sales contracts, while mortgage and gift transfers accounted for smaller shares. Ready properties generated the majority of value, while off-plan transactions remained slightly higher in volume.
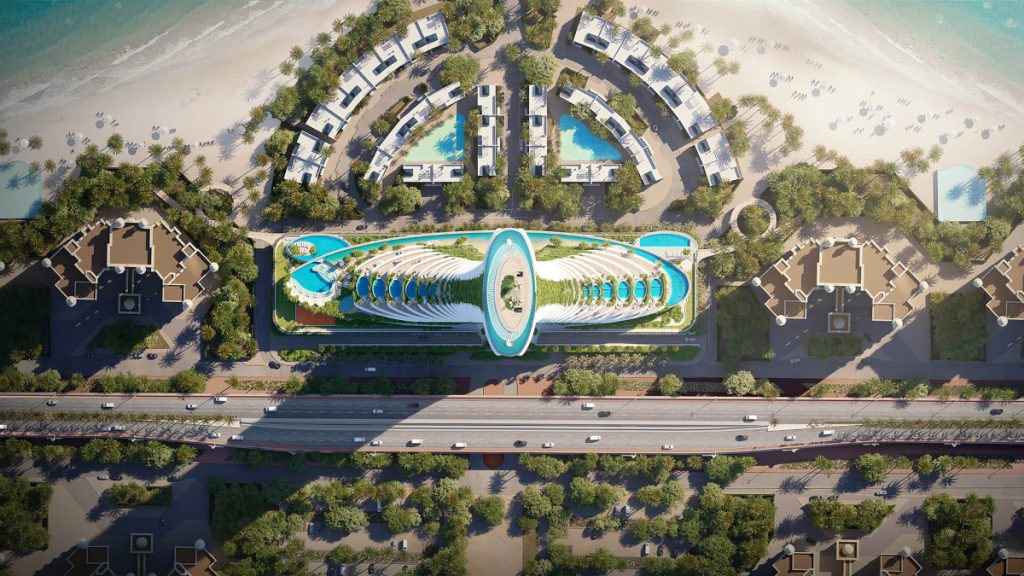
Como Residences Palm Jumeirah, Dubai
Source: Building Arabia.
Transactions by Sales Type
| Category | Number of Transactions | Value (AED) | Value (USD) |
|---|---|---|---|
| Gifts | 1,994 | 15,066,233,443 | 4,102,446,138 |
| Mortgage | 11,375 | 58,691,210,283 | 15,981,268,967 |
| Sales | 46,321 | 172,086,136,372 | 46,858,035,772 |
| Grand Total | 59,690 | 245,843,580,098 | 66,941,750,878 |
Transactions by Property Status
| Category | Number of Transactions | Value (AED) | Value (USD) |
|---|---|---|---|
| Off-Plan | 30,360 | 78,234,135,208 | 21,302,691,684 |
| Ready | 29,330 | 167,609,444,890 | 45,639,059,194 |
| Grand Total | 59,690 | 245,843,580,098 | 66,941,750,878 |
Transactions by Property Ownership Type
| Category | Number of Transactions | Value (AED) | Value (USD) |
|---|---|---|---|
| Free Hold | 57,367 | 230,679,137,146 | 62,812,562,872 |
| Non Free Hold | 2,323 | 15,164,442,952 | 4,129,188,006 |
| Grand Total | 59,690 | 245,843,580,098 | 66,941,750,878 |
Transactions by Property Usage
| Category | Number of Transactions | Value (AED) | Value (USD) |
|---|---|---|---|
| Commercial | 2,117 | 56,520,890,374 | 15,389,895,269 |
| Residential | 57,573 | 189,322,689,724 | 51,551,855,609 |
| Grand Total | 59,690 | 245,843,580,098 | 66,941,750,878 |
Transactions by Property Type
| Category | Number of Transactions | Value (AED) | Value (USD) |
|---|---|---|---|
| A) Building | 6,291 | 23,299,385,903 | 6,344,284,793 |
| Building | 3 | 118,225,000 | 32,191,967 |
| Villa | 6,288 | 23,181,160,903 | 6,312,092,826 |
| B) Land | 7,371 | 122,655,790,328 | 33,398,445,290 |
| Agricultural | 4 | 228,676,604 | 62,267,285 |
| Airport | 194 | 1,015,511,622 | 276,517,800 |
| Commercial | 1,970 | 52,990,831,733 | 14,429,089,648 |
| General Use | 574 | 11,339,047,636 | 3,087,555,517 |
| Government Housing | 147 | 472,949,369 | 128,781,312 |
| Industrial | 112 | 2,221,233,949 | 604,828,850 |
| Labor Camp | 25 | 233,859,215 | 63,678,615 |
| Land | 135 | 1,726,726,511 | 470,177,403 |
| Residential | 2,884 | 19,737,125,338 | 5,374,302,338 |
| Residential / Attached Villas | 23 | 40,160,000 | 10,935,330 |
| Residential / Residential Villa | 74 | 86,720,980 | 23,613,609 |
| Residential / Villas | 112 | 2,862,210,154 | 779,362,874 |
| Residential Flats | 86 | 1,698,690,256 | 462,543,296 |
| School | 5 | 1,208,030,181 | 328,939,464 |
| Shop | 5 | 67,500,000 | 18,379,850 |
| Shopping Mall | 1 | 10,500,074 | 2,859,108 |
| Sports Club | 9 | 1,064,465,404 | 289,847,625 |
| Unit | 15 | 365,822,802 | 99,611,382 |
| Villa | 90 | 1,624,272,084 | 442,279,533 |
| Warehouse | 2 | 12,650,088 | 3,444,544 |
| Other | 904 | 23,648,806,327 | 6,439,430,041 |
| C) Unit | 46,028 | 99,888,403,867 | 27,199,020,794 |
| Flat | 42,498 | 82,182,616,675 | 22,377,839,803 |
| Gymnasium | 1 | 2,307,692 | 628,371 |
| Hotel | 3 | 862,000,000 | 234,717,495 |
| Hotel Apartment | 604 | 1,741,888,341 | 474,305,879 |
| Hotel Rooms | 296 | 334,239,231 | 91,011,363 |
| Office | 1,895 | 8,820,574,834 | 2,401,790,288 |
| Shop | 701 | 2,616,391,152 | 712,427,815 |
| Show Rooms | 6 | 21,379,663 | 5,821,556 |
| Sized Partition | 3 | 3,273,438,504 | 891,337,918 |
| Stacked Townhouses | 7 | 12,538,834 | 3,414,250 |
| Warehouse | 3 | 11,840,000 | 3,223,962 |
| Workshop | 11 | 9,188,940 | 2,502,094 |
| Grand Total | 59,690 | 245,843,580,098 | 66,941,750,878 |
Top 10 Localities by Value
| Locality | Number of Transactions | Value (AED) | Value (USD) |
|---|---|---|---|
| PALM JUMEIRAH | 598 | 15,396,921,488 | 4,192,490,534 |
| Al Yelayiss 1 | 2,784 | 12,582,711,224 | 3,426,197,746 |
| DUBAI WATER FRONT | 13 | 11,109,241,284 | 3,025,116,755 |
| BUSINESS BAY | 3,090 | 10,603,048,876 | 2,887,147,413 |
| Me'Aisem Second | 524 | 9,671,319,216 | 2,633,442,945 |
| Al Rowaiyah First | 7 | 8,873,529,352 | 2,416,209,490 |
| Palm Deira | 1,669 | 6,767,445,962 | 1,842,735,456 |
| Al Yelayiss 5 | 773 | 5,629,560,755 | 1,532,896,053 |
| JUMEIRAH VILLAGE CIRCLE | 4,013 | 5,530,044,474 | 1,505,798,359 |
| Madinat Al Mataar | 2,530 | 5,502,498,573 | 1,498,297,637 |
A total of 182 other localities recorded transactions, with a combined value of AED 164,816,258,894. Examples from the next highest areas include Hadaeq Sheikh Mohammed Bin Rashid, BURJ KHALIFA, and Palm Jabal Ali.
Conclusion
Sales transactions accounted for the majority of activity, followed by mortgage registrations, with gifts forming a smaller share. Residential usage dominated both volume and overall value.
Ready properties generated higher aggregate value compared to off-plan assets. Free Hold ownership represented the majority of transactions across the period. Within property types, land transactions contributed the largest share of total value, followed by unit transactions.
--
Disclaimer
This report is based on publicly available market transaction summaries and compiled data related to Dubai real estate activity for the stated period.
Figures are presented for informational purposes only and may vary from final official statistics published by the Dubai Land Department (DLD).
1 US Dollar = 3.6725 UAE Dirhams
This material does not constitute financial or investment advice. Real estate investments involve risk and readers should conduct independent research before making any investment decisions.