Shopify Inc. technical analysis
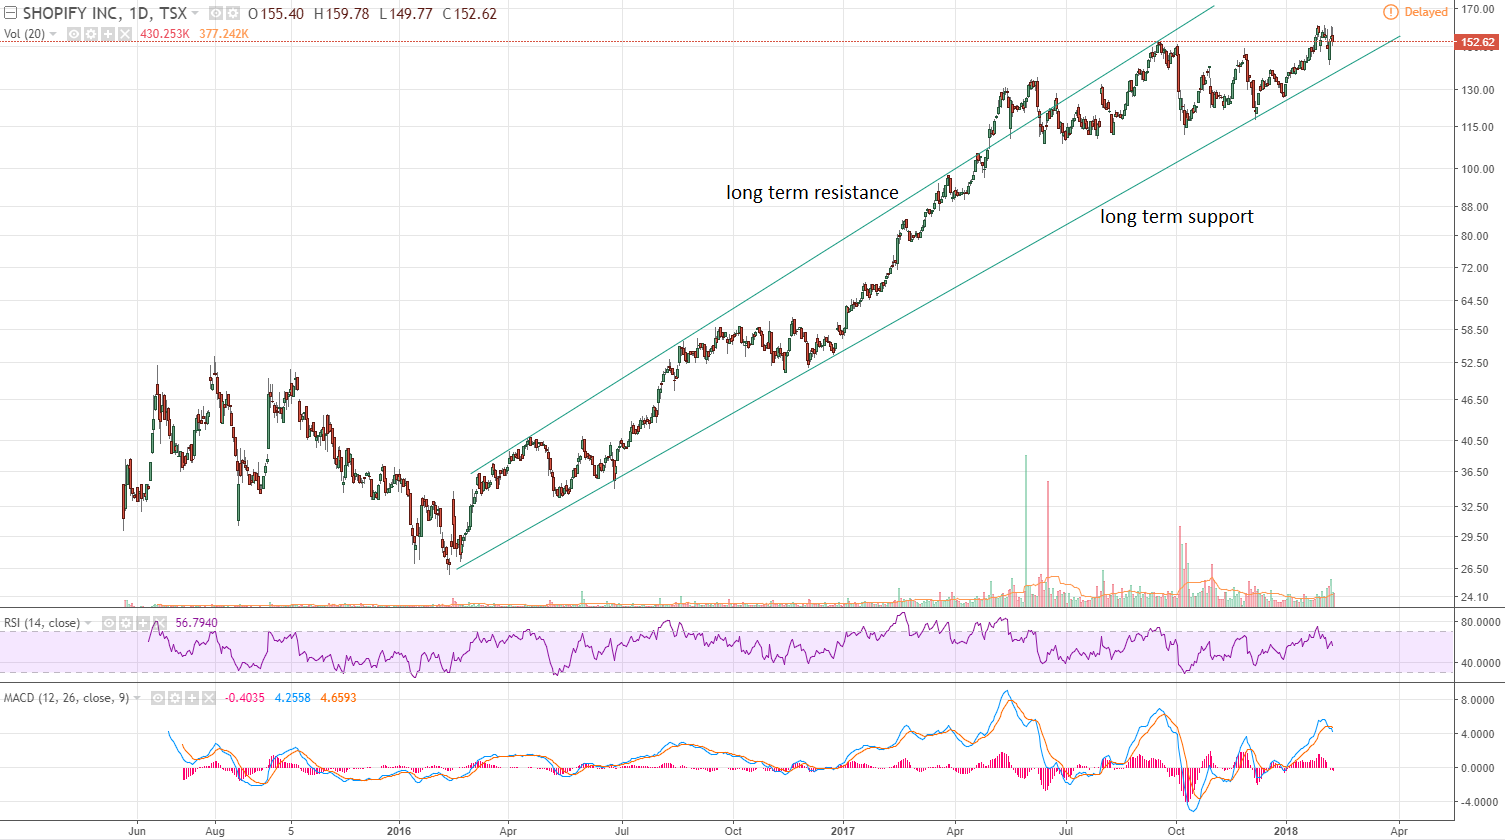
Shopify Inc. has been bouncing in a channel for 2 years. The daily RSI is 56.8 which isn't oversold or overbought. The MACD just crossed over into the negative area which is a bearish sign. SHOP should stay bullish as long as it doesn't break the long term support.
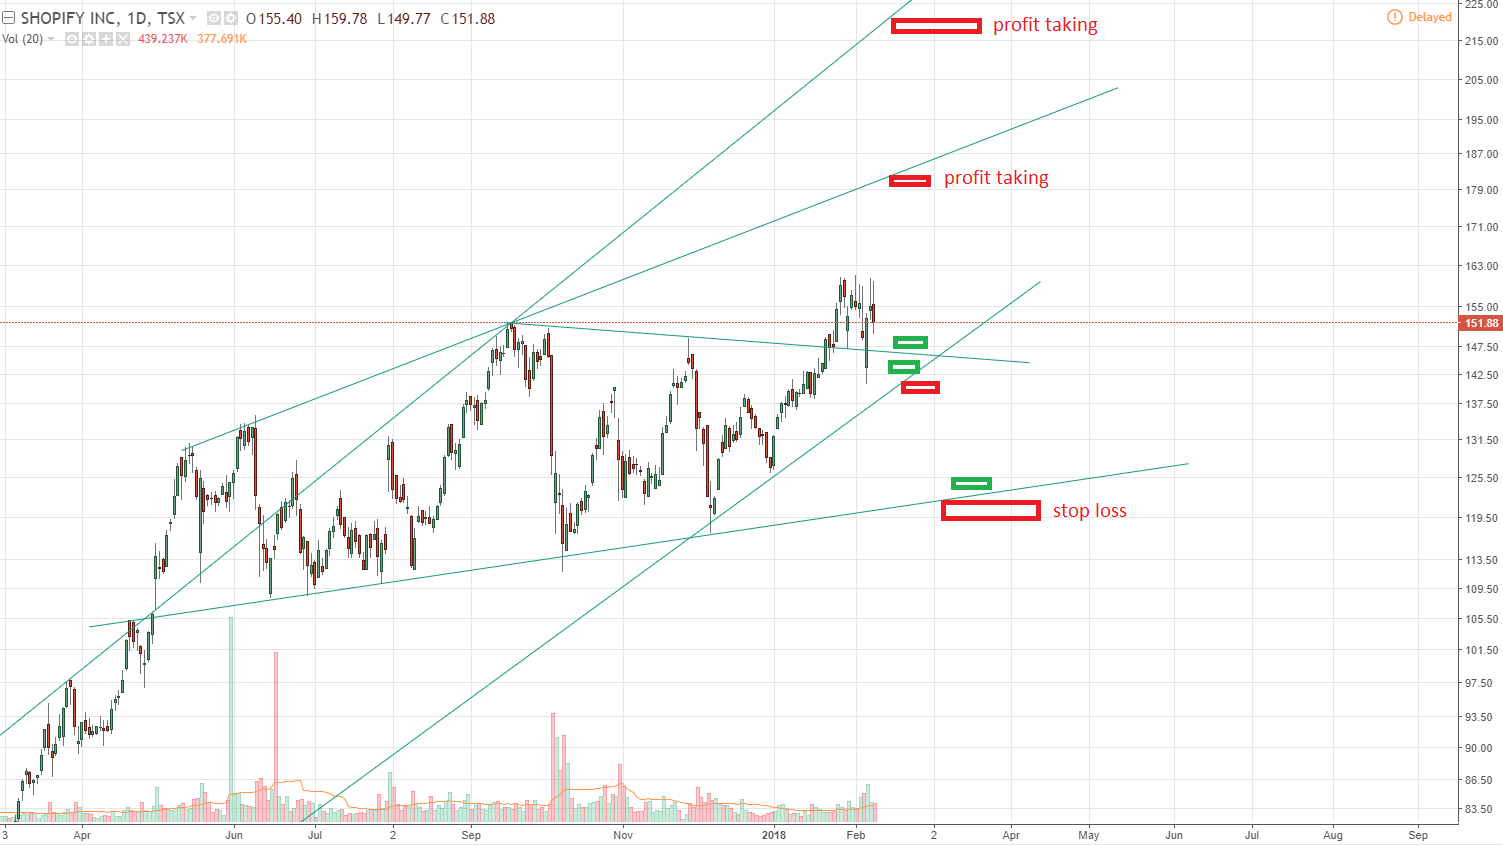
It recently broke a resistance at $ 153 which is a bullish sign. Because last days, the S&P500, NASDAQ and Dow Jones took a a big hit, it might not be a bad idea to be carefull when trading products like Shopify Inc. Those big indices gained alot in recent years. And when these indices crash, SHOP will propably follow them. Because of risk management I've put a stop loss around $ 120.
In general, you buy above the support and sell under it. And ofcourse there should be some profit taking when you near a resistance. The red rectangles are the selling areas and the green rectangles are the buying areas. The bigger the rectangle, the greater the trade.
Disclaimer: This is not financial advise.
I just want to give my humble opinion on some products by doing technical analysis. There may be some minor and/or major flaws. Nobody is perfect and I'm willing to learn from my mistakes through your opinions. Thank you.
Money making posts:
https://steemit.com/money/@bo3ia/how-to-make-money-in-stocks-and-cryptocurrencies
https://steemit.com/money/@bo3ia/make-money-with-the-s-and-p500-index
https://steemit.com/cryptocurrency/@bo3ia/risk-management-in-cryptocurrency-and-stocks
Image source: https://www.tradingview.com/