A Manifesto For The Big Short
I run a Facebook group called "The Big Short: Profit From The Coming Crash" (https://www.facebook.com/groups/thebigshort/) because I believe that screwing the horribly inflated stock market for everything it has happens to be one of the most outstanding opportunities of our time.
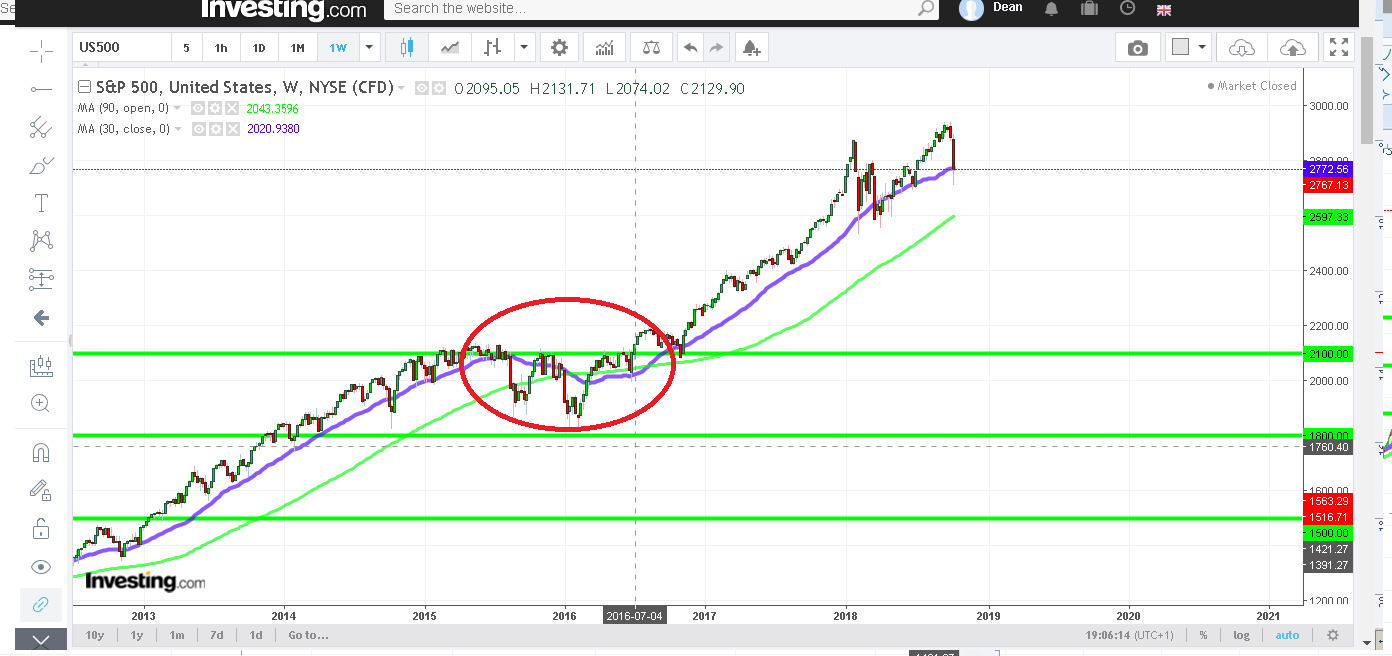
Lets put it like this. Short positions against the S&P500 could have bagged as much as 50% unleveraged if initiatated at the top of the market in 2007 and 2000 respectively.
Now looking at this chart, you can probably guess where I'm going. Yep, an attack against the current aging bull market could yield as much as 70% unleveraged.
This is an enormous opportunity for those who are prepared to spend time and effort prepping decent entries to short equities and other financial assets.
Lets look at some of the most obvious points here:
- Pin-point accuracy not required.
The bear markets that ran after the 2001 Tech bubble burst and in 2008 after the housing bubble burst ran for 823 and 490 days respectively.
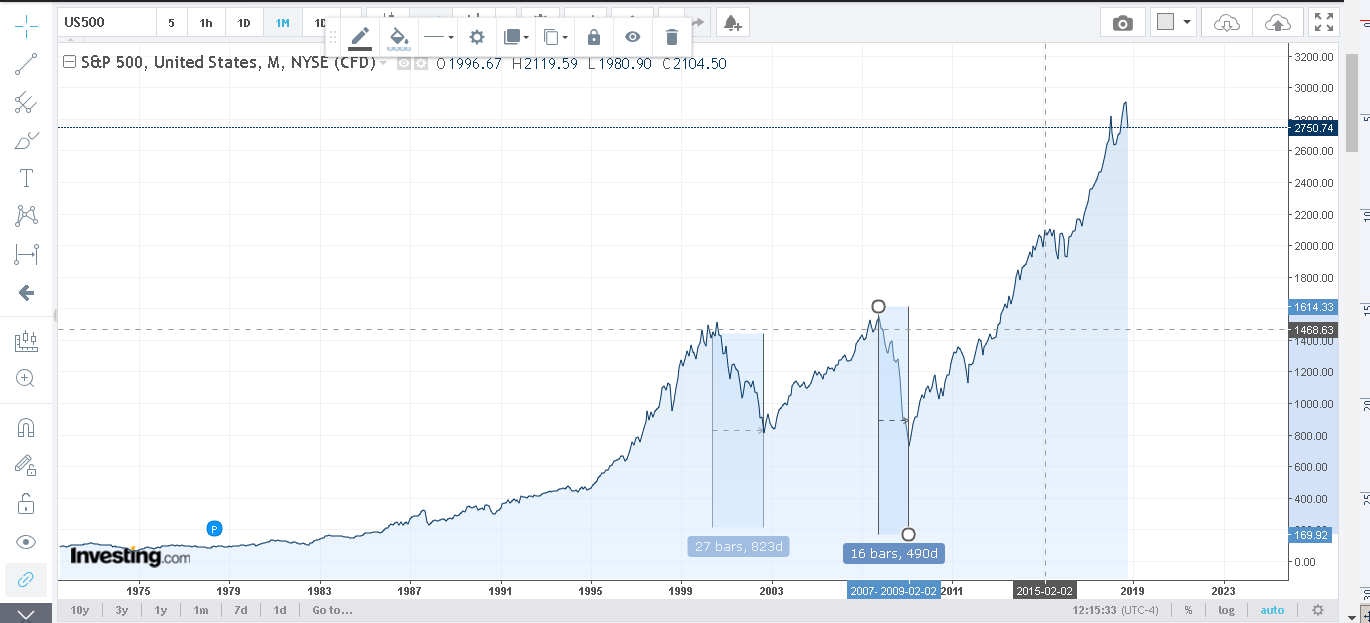
This graphic from First Trust demonstrates the point further. Most proper bear markets (I exclude flash-crashes which last only weeks/days from the definition thus) run for many months if not years.
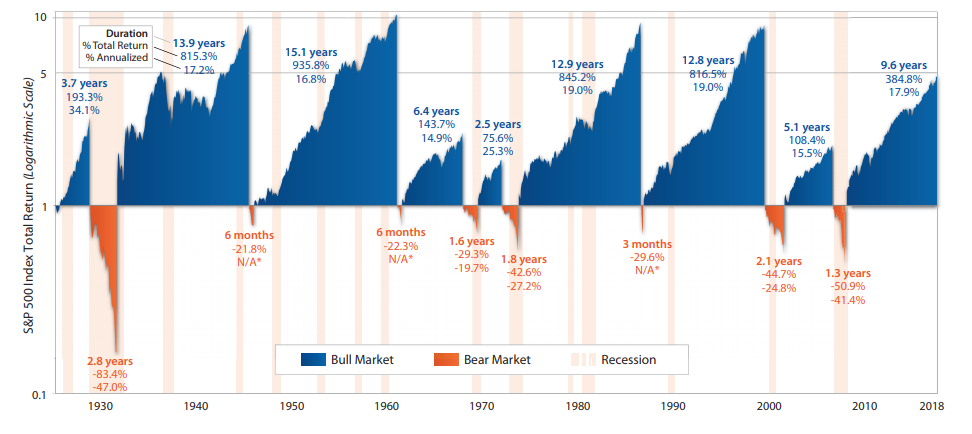
Think about this... that means that a bear market will be 1-2 years in length. This means you have a lot of time to reap the potential benefits from one.
Secondly, lets look at what happens during an actual bear-market initiating crash then we can pick some useful features out which reinforce this point.
When we look at long-term charts which cover months-to-years, then we usually look at them on low resolution and average out the daily and hourly values into bigger units of time.
If we look at a long-term chart on a higher resolution (the following chart is in daily mode) then we can look at actually what happened during the periods which initiated a bear market.
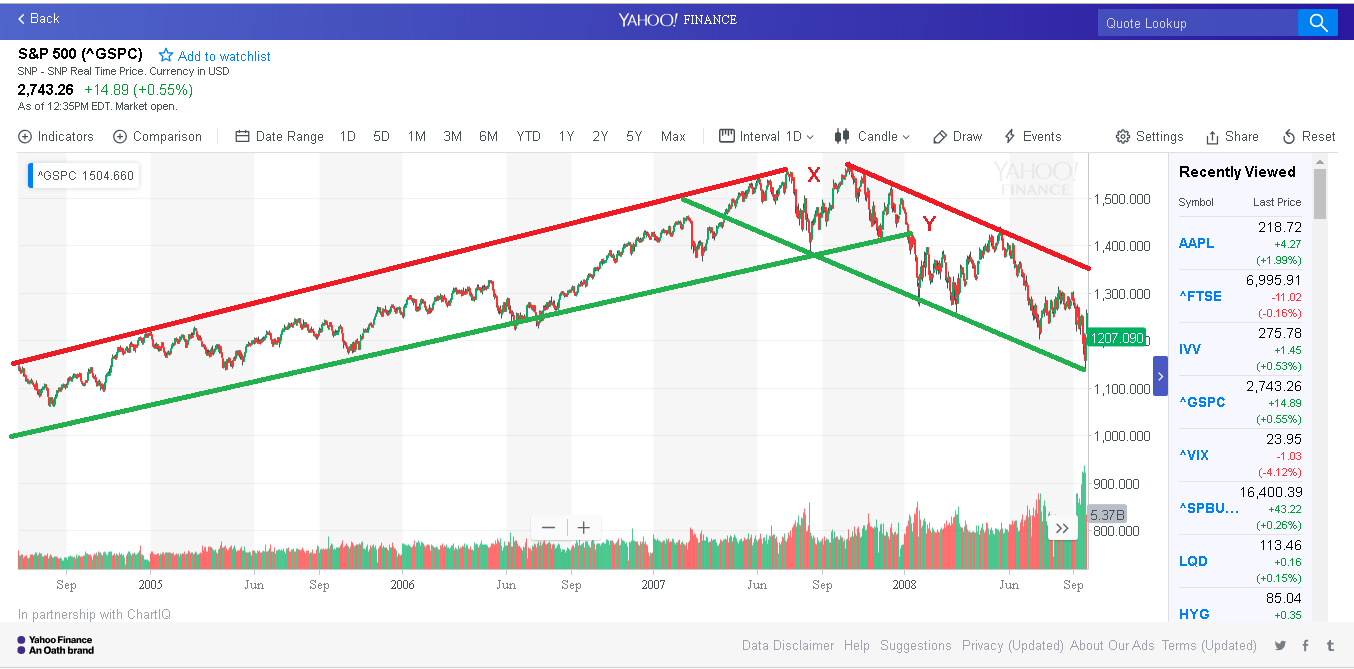
The main events I pick out here are X and Y.
Support is represented in Green, Overhead Resistance in Red.
X represents the period of July - December 2007 at the end of which the uptrend stalls.
Y represents the period of January 2008 onwards at which the downtrend establishes itself.
Now we can rule major events like Lehman Brothers out of this because this did not occur until much later in 2008
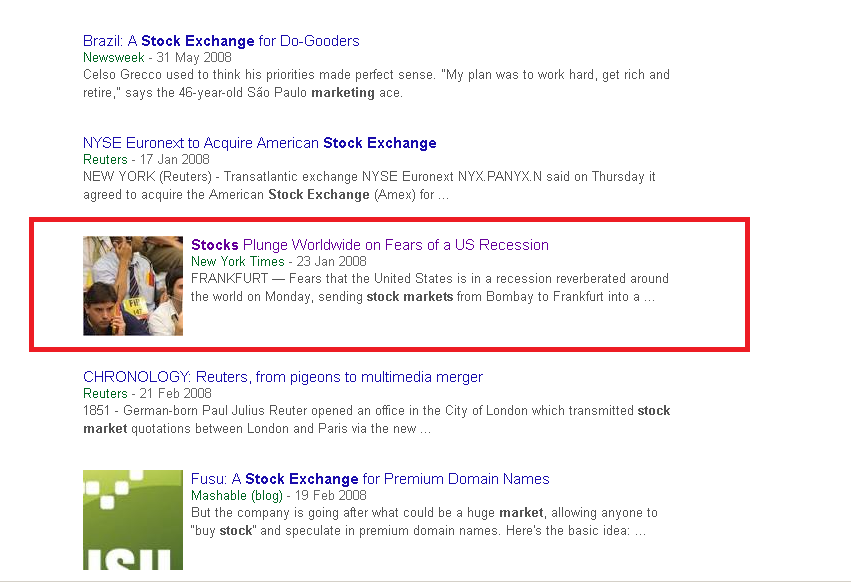
If we look at Google News for these periods we can see some interesting factors here.
This is the Google news search for 1/7/2007 - 31/12/2007
Conspicuously absent is anything remotely referring to panic, recession, collapse, etc. etc. So in short if we're looking for panic signals in the news we might be looking in the wrong places.
A Google news search of the same period for "recession" in fact produces lots of denialism (Most notably from Ben Bernanke, chair of the Federal Reserve for this point in time) and frankly mixed debate about whether it is or isn't a recession.
A search for the latter period 1/1/2008 - 1/6/2008 reveals a similar dearth of panic in google news.
Notably, the primary article covering the downturn being a single NY Times piece .
What is the conclusion of all this?
The conclusion is that if you're looking for a "BEAR MARKET BEGINS" announcement in the media and news industry, you are probably looking in the wrong place. The media will be last to the party as always.
Instead, we need to rely on the figures and the technicals.
The main feature I'm looking for on the stock indexes (to be clear, I am focusing on indexes because I believe that it's index funds and etfs driving a good chunk of the bubble this time and they also serve as aggregators for the value of the equities market writ-large) are ultimately broken trends and volumetric volatility.
What do I mean by this?
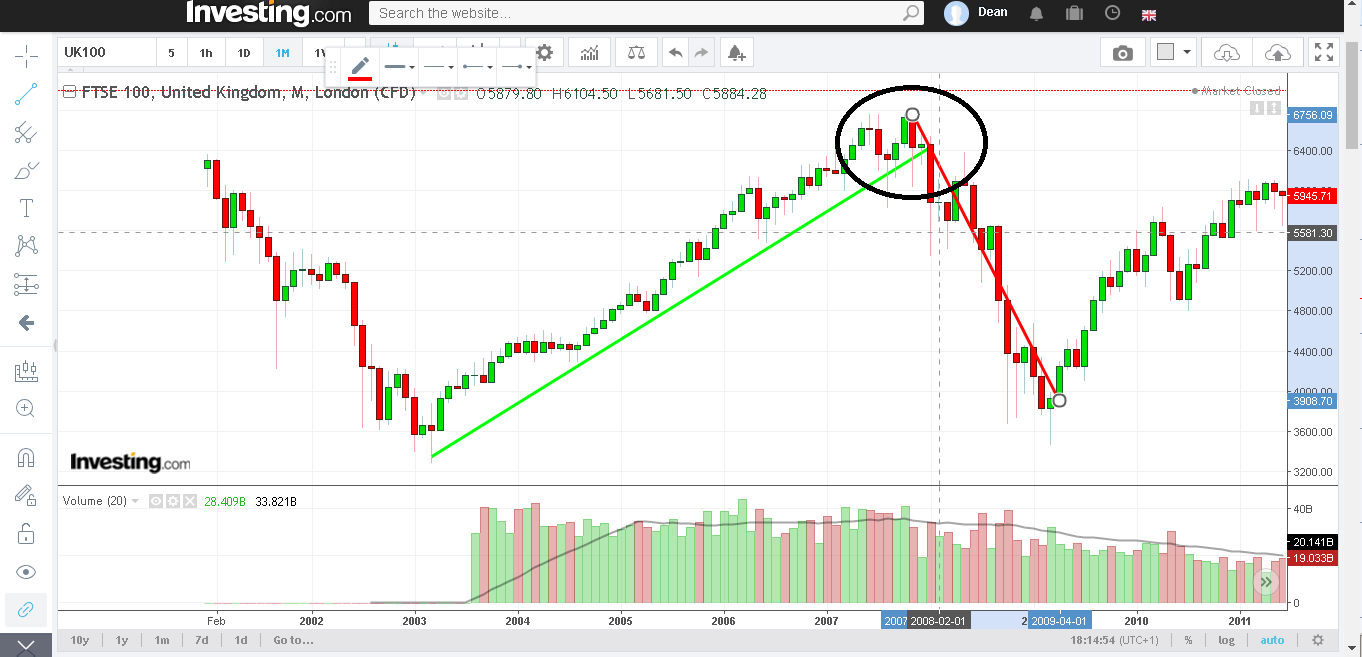
Well, here's some examples. First in the FTSE100, we can see how the bull-run of the post-2000 era comes to an abrupt end as the uptrend is violated by a very aggressive downtrend.
Similarly on the S&P500 the main defining characteristic of the initial phase of the crash was a dead long-term uptrend which is violated by an aggressive downtrend.
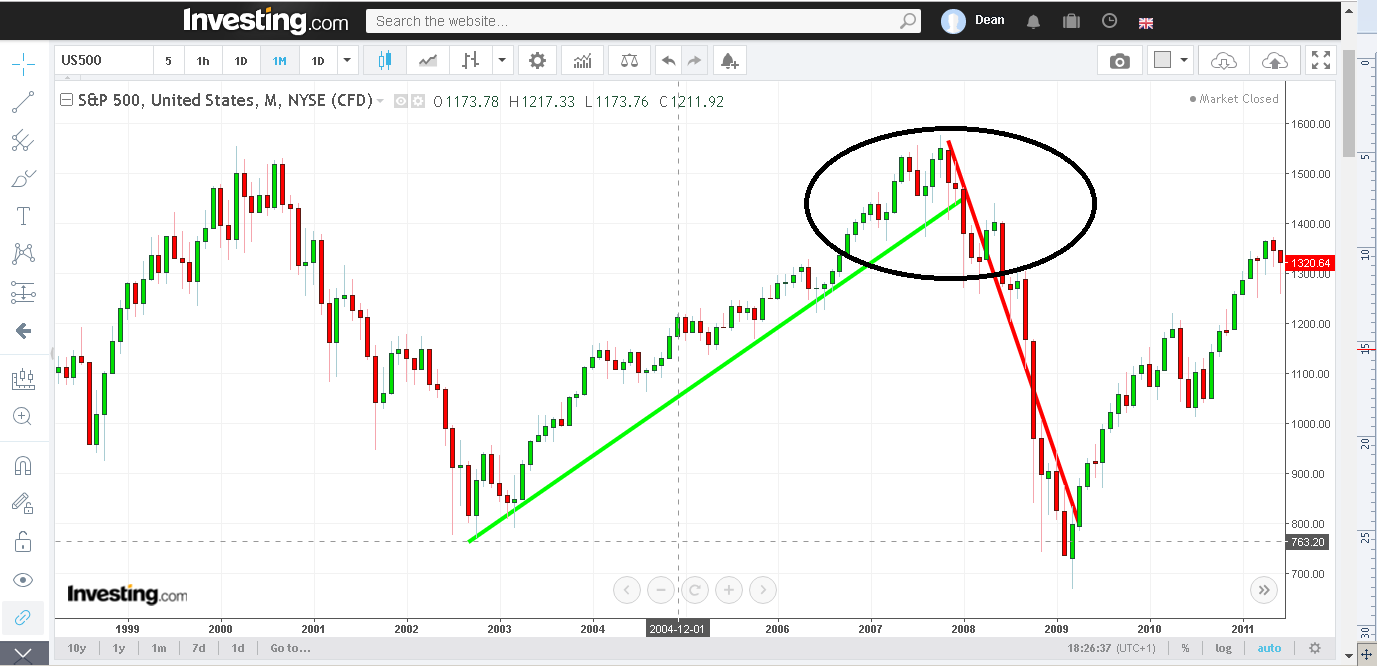
So thus this is what I believe we need to look for in shorting the markets. The primary starting gun mechanism will be a dead long-term downtrend on the weekly/monthly charts.
One of the primary ways in which I am actively searching for this is via the use of simple Moving Average crossovers.
Let me demonstrate how this works.
I enclose a snapshot of the S&P500 from the 2000 - 2010 period characterised by two distinct bubbles and subsequent crashes.
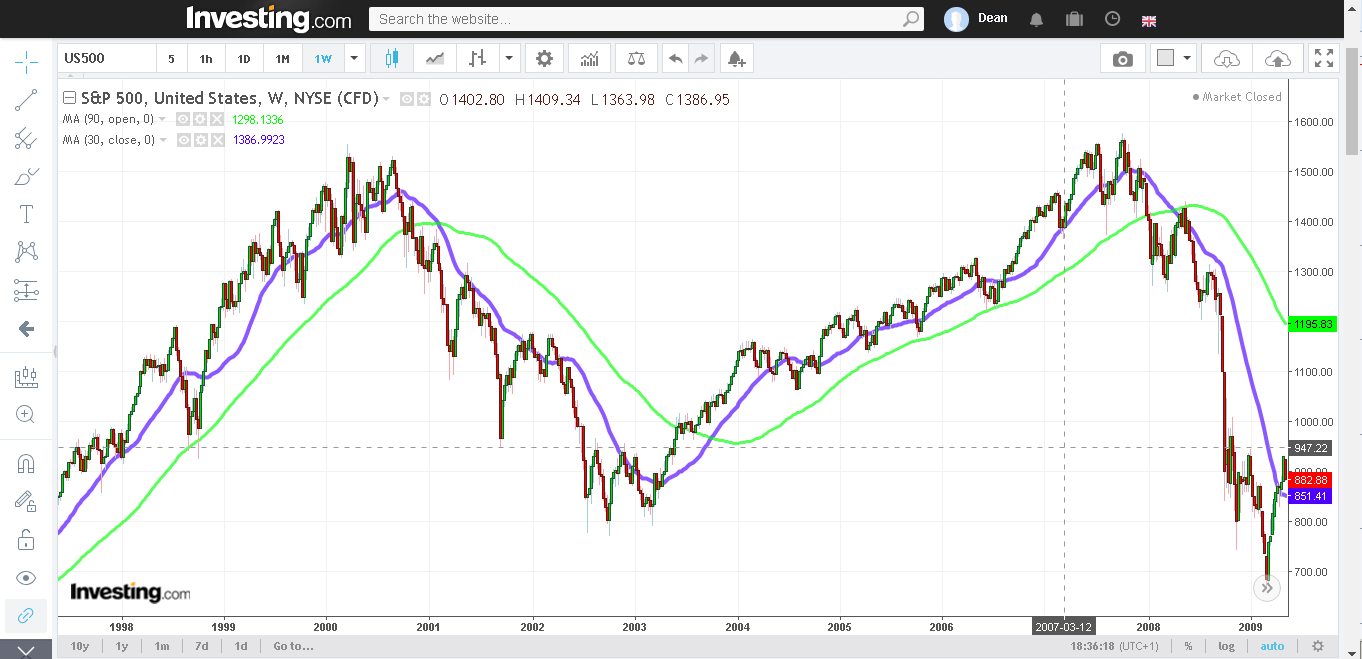
The Green MA averages prices out over 90 days. The Blue MA averages price out over 30 days.
So we are effectively comparing a 1 month price range to a 3 month price range.
Now if you compare what happens to the indicators when we actually enter a bear market properly, then we have a lovely neat and tidy crossover in both instances.
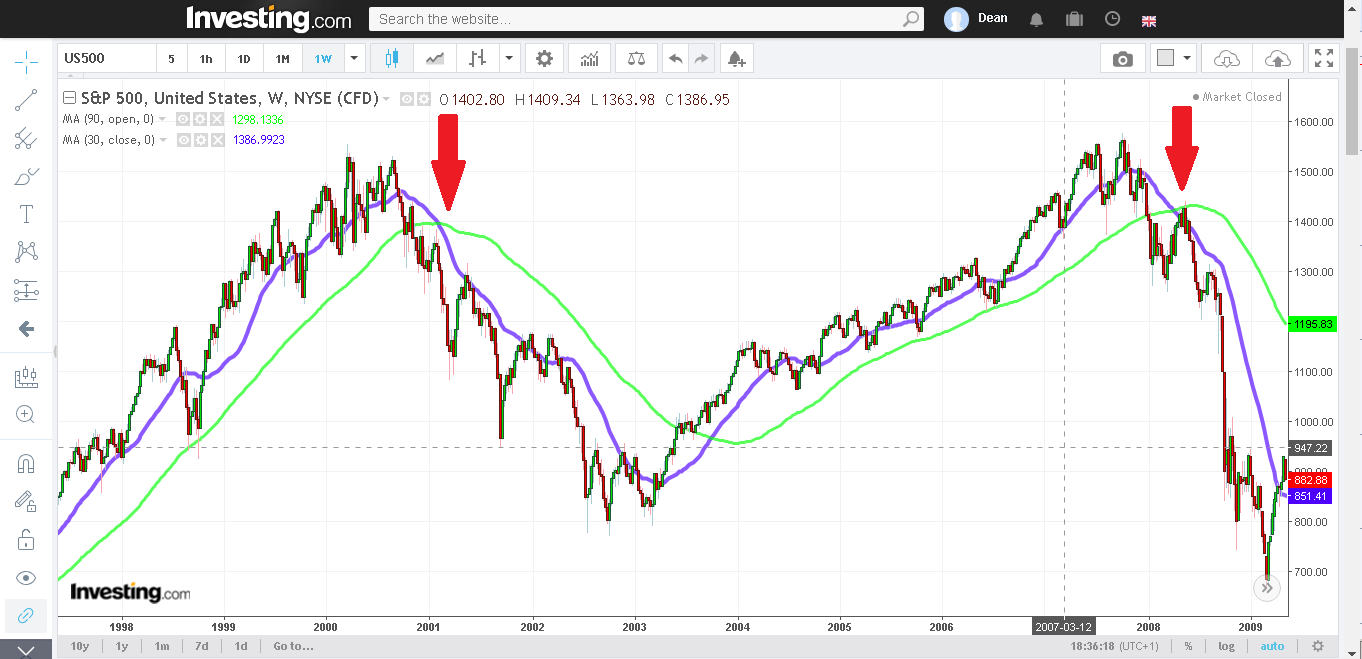
Furthermore, rather interestingly, there is a spike in both instances which takes us back up to the cross point
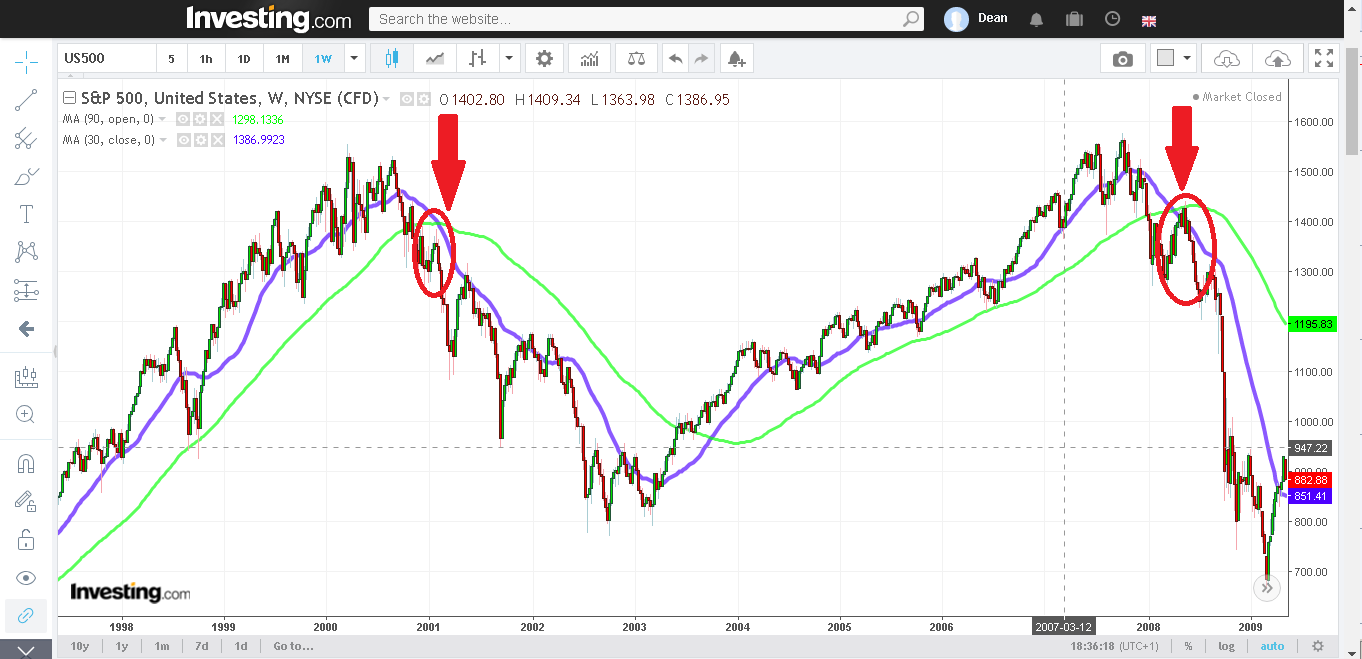
This would have been a brilliant entry point for shorts against these markets because by this time the trend of course is broken and we have a spike which raises our entry price - thus extending the range of our possible short down to bedrock.
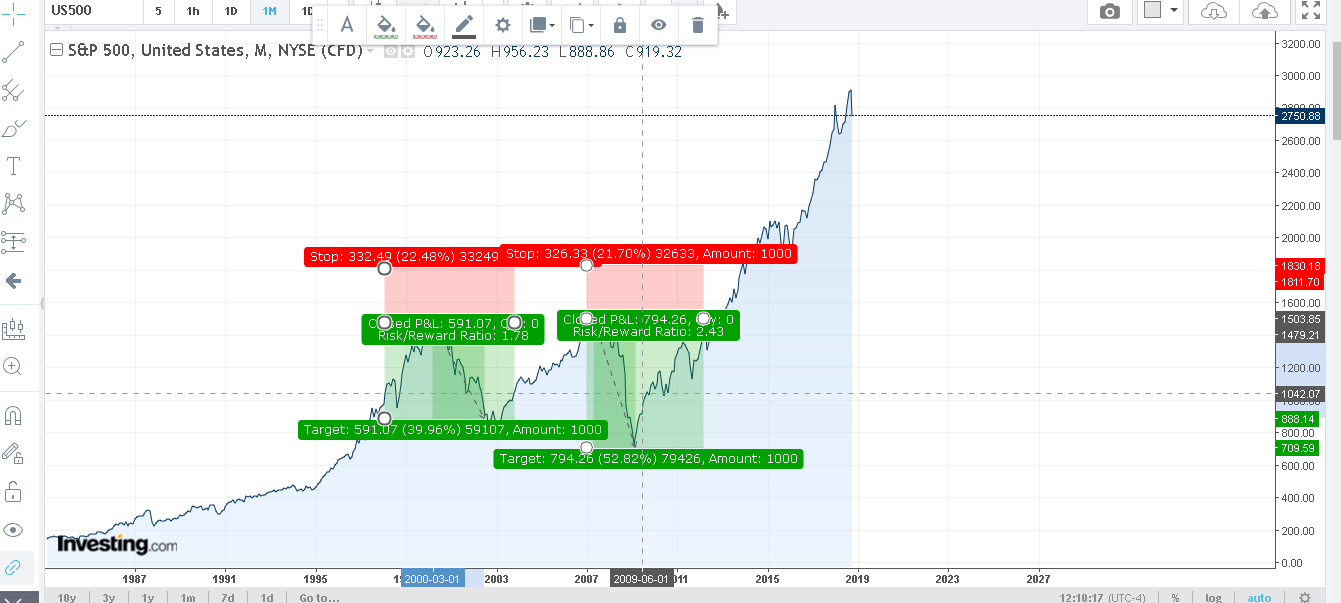
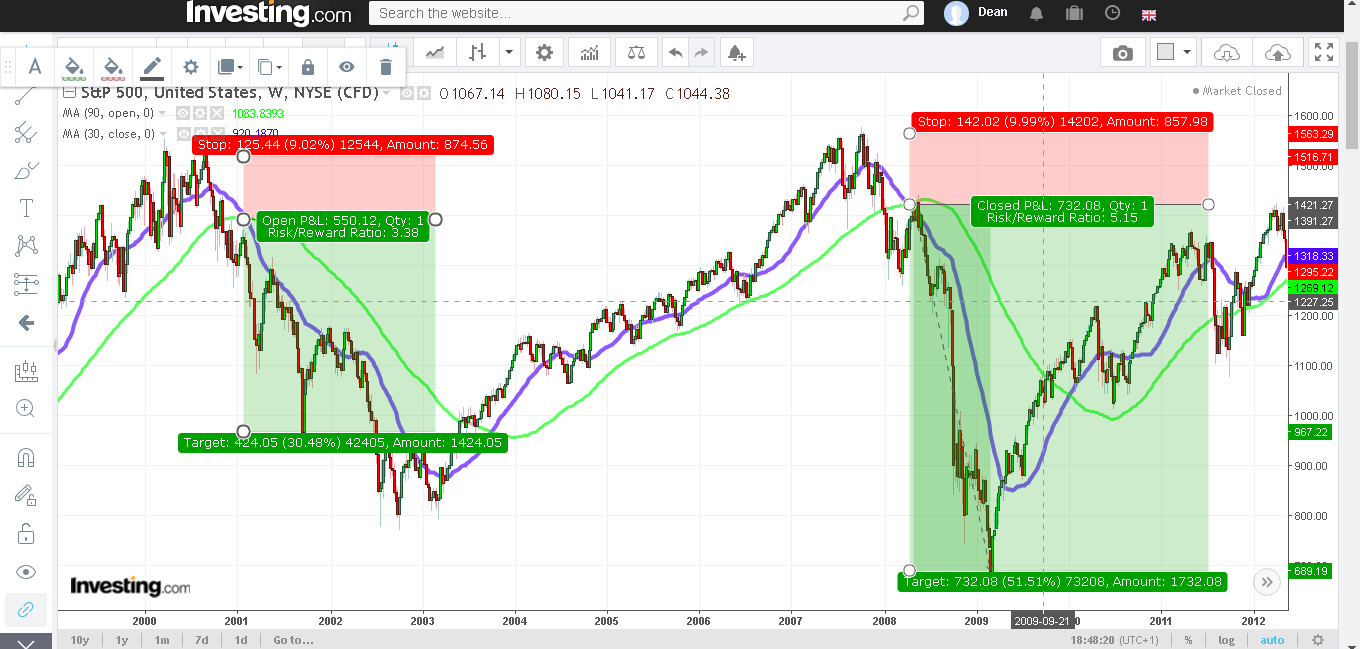
Here are a couple of example plays against both the tech bubble and the housing bubble on the S&P500.
A few points:
Stop loss is simply set at the all-time high. It would be necessary for the price to break this to continue the bull market and makes for an obvious point to get out of the market should confidence return and the price turns against you.
The entry point is set at the MA cross. This occurs on a spike in both instances which I think is more than a coincidence theorise is caused by people following TA to guide their buying and selling or even algorithmic trading.
There are a couple of options for exit in-profit which I outline.
In the tech bubble, I take a conservative outline and set the take-profit point at instance of the 30 day MA reasserting itself and crossing back over the 90 day MA. This would have taken around 30% unleveraged. Note that there would have been no real way to guess this, and you are forced to micro-manage the position and watch the MA cross closely to generate your signal to close the position in profit. Executed properly then this takes around 30%.
Against the housing bubble, I instead just pick the more adventurous line of ignoring the MA's and guesstimating the depth of the crash. Timed right this takes more margin but is obviously riskier - returning 50% - but would be much harder in practice to find the price level for.
For our current bull market, then it is effectively impossible to know the final resting place beforehand. It all depends on what happens on the day of judgement itself so-to-speak. However, we can look at the historical pricing and make some informed guesses based on TA.
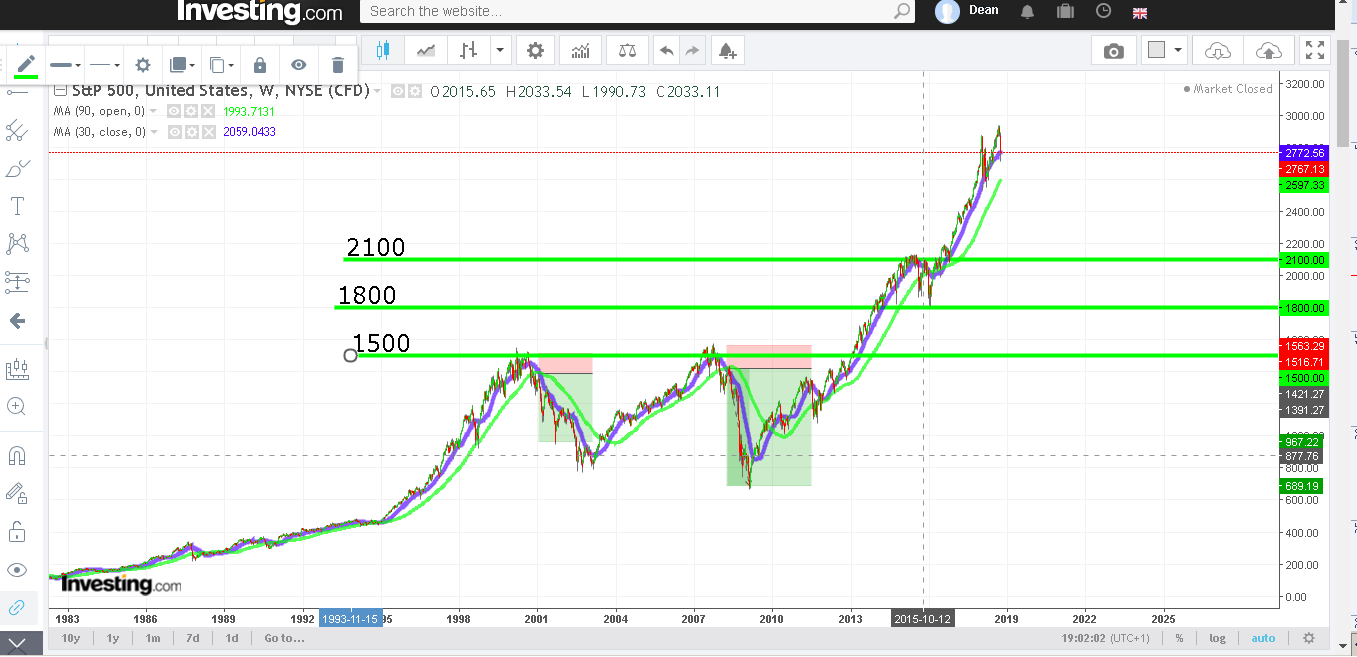
My first 3 guesses are as follows:
- The 2100 point. Which I believe is the top of tbe "Brexit" conflagration.
- The 1800 point. Which I believe is the bottom of the "Brexit Conflagration".
- The 1500 point. The old overhead resistance point for the 2000 era bull markets which would likely now serve as a pivot for support since being broken in 2013.
To get this right then we would have to watch for signs of a reversal on the MA's which would ruin the position. This occurred in 2016 during the Brexit conflagration when the MA's crossed briefly (likely triggering lots of algorithmic trading routines which caused selloffs) and then the 30 day MA reasserts itself and continues higher - voiding the cross.
This is why constant monitoring of your trades is important.
Don't forget, the indicators we use are #moving averages#.
That means they average the price out over a particular range to produce a linear indicator.
This means that they do not respond immediately to what's going on in the market, but have a certain "lag" to them.
Thus, this reduces our own necessity for extreme accuracy in timing because if you look at how long it takes for the de facto crash to feed through into the moving averages and produce our sell signals, then it's more than 100 days in both examples here.
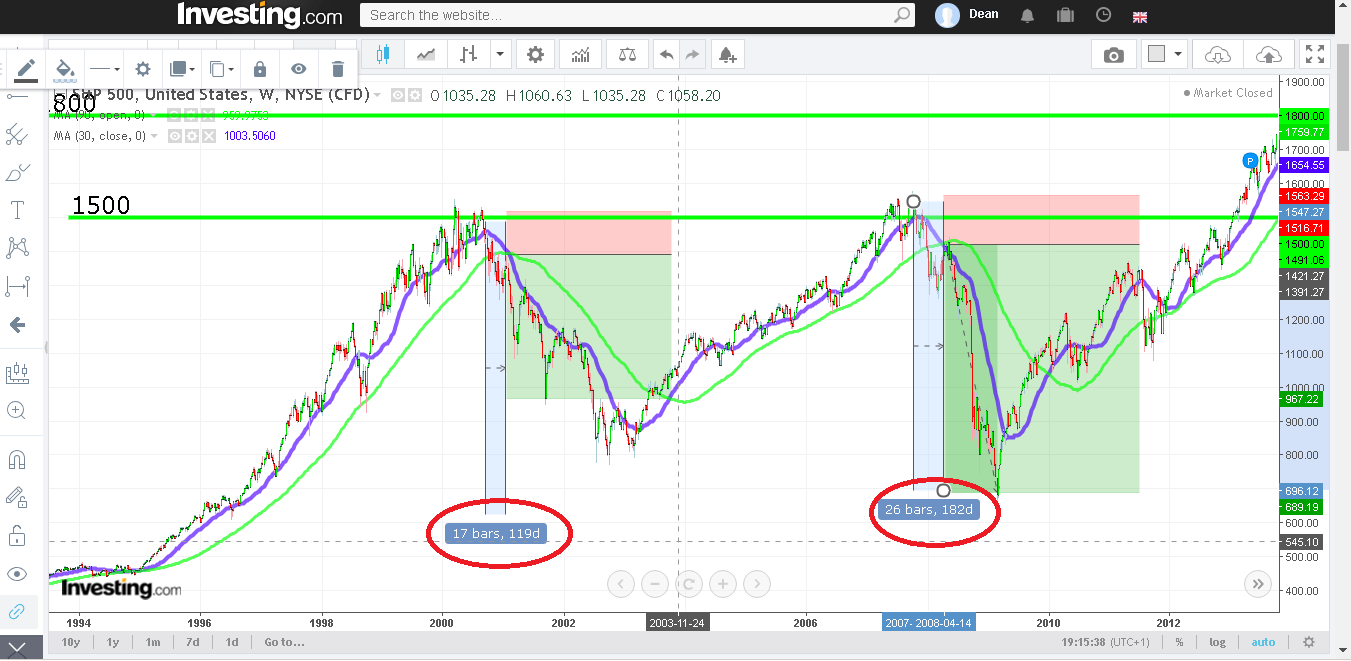
This means that from top-of-market to entry into your short position that you will have around 100-200 days to monitor the situation and to make your call.
So this is my outline for what will surely be the short of our lifetimes when the aging bull market finally dies (or more likely, is butchered by the Federal Reserve) and we experience our first proper bear market in a decade.
Join us in The Big Short group and, in the words of The Wolf of Wall St....

Interesting. Thanks!
What instrument do you use for shorting?
I use Contract-For-Difference (CFD) derivatives through a variety of brokers. Mainly British ones. Each broker has their own policy on configuration of contracts which make some more profitable than others but I usually find higher profit contracts the overall risk is greater. Lower risk contracts tend to have greater brokers fees and spreads. Swings and roundabouts. Have a shop around the CFD market and just try a few out as most will give you a small demo account to test run.
Congratulations @intellivestor! You have completed the following achievement on the Steem blockchain and have been rewarded with new badge(s) :
Click on the badge to view your Board of Honor.
If you no longer want to receive notifications, reply to this comment with the word
STOPDo not miss the last post from @steemitboard: