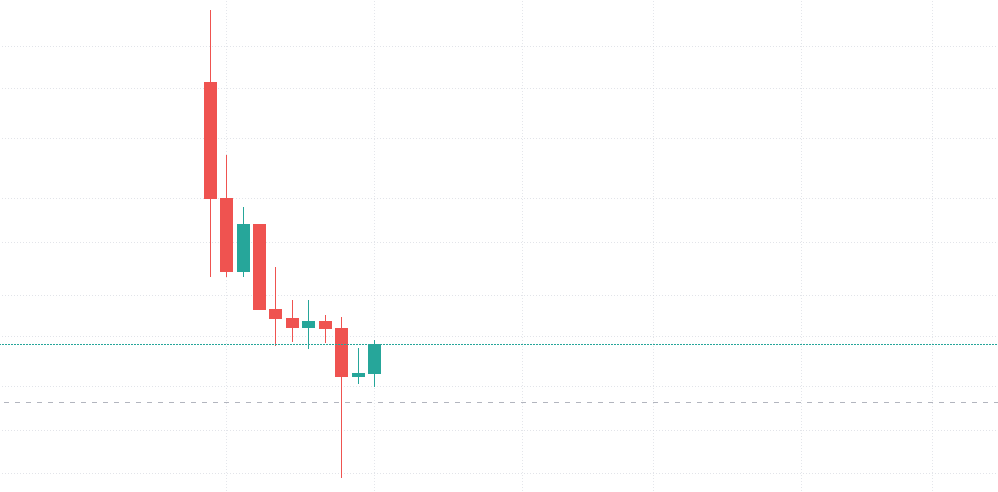
Hive USD chart and price analysis
Hive/USD pair chart is looking ugly. It is just straight falling knife which was formed after the hype and burst of hive coin. It might be stable for few months and start going up or continue going down, the odds of it going down are high because the price is very much dependent upon people selling steem and buying hive by powering down. But now the number of people who can do so is decreasing and chart is already very bearish with almost no sign of recovery.
- I am not a financial advisor.
- You should trade only if you can loose money and still be fine.
- Do your own research.
Visit my trading courses.
Trading course series - #1 - Introduction
Trading course series - #2 - Risk management
Trading course series - #3 - Risk reward ratio
Trading course series - #4 - Patterns(1)
Trading course series - #5 - Patterns(2)
Trading course series - #6 - Patterns(3)
Trading course series - #7 - RSI
Trading course series - #8 - Support and resistance