Steem API Health — Daily Report 2026-04-28
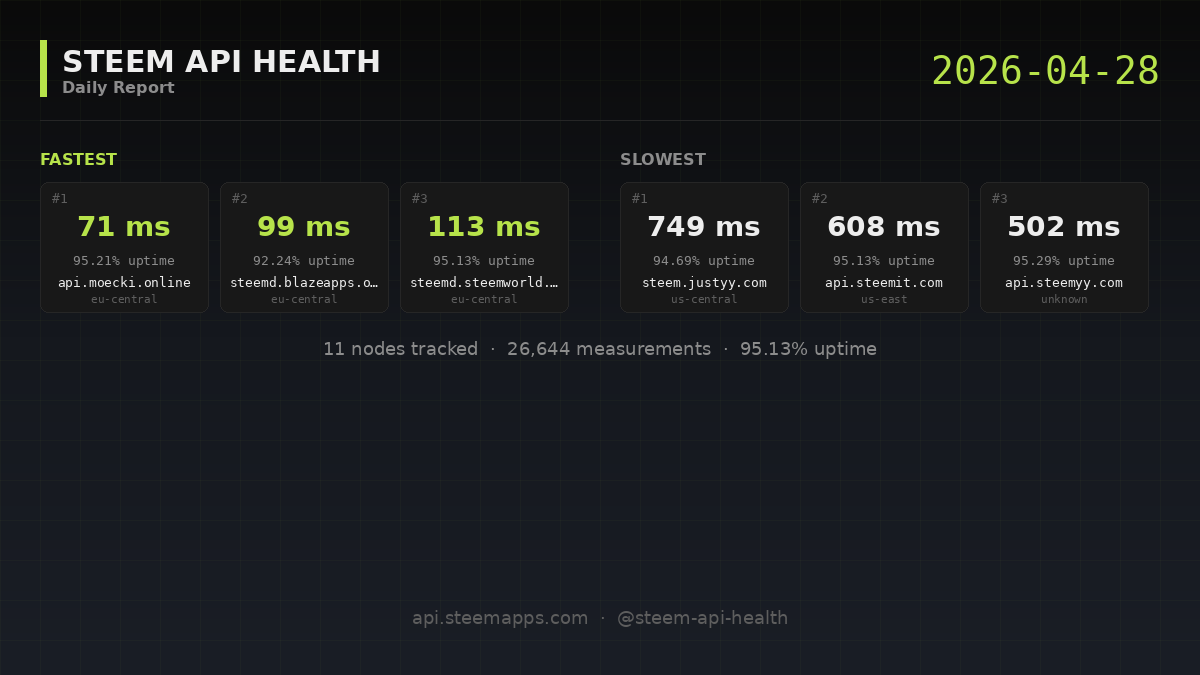
On 2026-04-28 (UTC) the monitor tracked 11 Steem API nodes with a global uptime of 95.13% across 26,644 measurements. Median latency across all nodes: 397 ms. Today's full picture and notable patterns below.
Measurements in this report come from multiple geographic locations thanks to community contributors. See the Sources page for the full list of operators feeding this dashboard.
Observations
- Longest outage today:
steem.justyy.com, 123 consecutive failed minutes. - Fleet trend: median latency regressed by 46 ms vs. yesterday (+46 ms; now 397 ms).
- Fastest node:
api.moecki.onlineat 71 ms average. That is 300 ms below the fleet average of 371 ms across 11 nodes. - Slowest node:
steem.justyy.comat 749 ms average. That is 378 ms above the fleet average of 371 ms.
Nodes
| Node | Region | Uptime | Avg | p50 | p95 | p99 | Errors | Error classes |
|---|---|---|---|---|---|---|---|---|
api2.steemyy.com | global | 96.24 % | 348 ms (avg of 2 sources) | 262 ms | 512 ms | 646 ms | 95 | timeout ×95 |
api.steem.fans | asia | 96.12 % | 481 ms (avg of 2 sources) | 280 ms | 1357 ms | 2671 ms | 98 | other ×2, rpc_error ×2, timeout ×94 |
api.campingclub.me | asia | 95.40 % | 397 ms (avg of 2 sources) | 221 ms | 1172 ms | 2347 ms | 116 | connect_error ×1, other ×3, rpc_error ×6, timeout ×106 |
api.steemyy.com | unknown | 95.29 % | 502 ms (avg of 2 sources) | 439 ms | 859 ms | 1346 ms | 119 | timeout ×119 |
api.moecki.online | eu-central | 95.21 % | 71 ms (avg of 2 sources) | 48 ms | 128 ms | 386 ms | 121 | timeout ×121 |
steem.senior.workers.dev | global | 95.17 % | 407 ms (avg of 2 sources) | 372 ms | 703 ms | 1702 ms | 122 | other ×1, timeout ×121 |
steemd.steemworld.org | eu-central | 95.13 % | 113 ms (avg of 2 sources) | 101 ms | 152 ms | 162 ms | 123 | timeout ×123 |
api.steemit.com | us-east | 95.13 % | 608 ms (avg of 2 sources) | 485 ms | 1527 ms | 2519 ms | 123 | http_5xx ×1, other ×4, timeout ×118 |
steem.justyy.com | us-central | 94.69 % | 749 ms (avg of 2 sources) | 607 ms | 1574 ms | 3432 ms | 134 | http_4xx ×1, http_5xx ×4, other ×4, timeout ×125 |
api.justyy.com | us-west | 94.53 % | 304 ms (avg of 2 sources) | 316 ms | 343 ms | 393 ms | 138 | connect_error ×17, timeout ×121 |
steemd.blazeapps.org | eu-central | 92.24 % | 99 ms | 66 ms | 86 ms | 358 ms | 109 | timeout ×109 |
Latency distribution
Across 25,346 successful measurements today: 34.5 % under 200 ms, 75.6 % under 500 ms, 96.6 % under 1 000 ms. (3.4 % were slower than 1 second.)
Time-of-day pattern
Best hour today: 23:00–00:00 UTC (avg latency 279 ms, 649 measurements). Worst hour: 19:00–20:00 UTC (avg latency 4214 ms, 23 measurements).
Error pattern
Most common error today: timeout (96.5 %), followed by connect_error (1.4 %), followed by other (1.1 %) (of 1,298 total errors).
Biggest outage of the day
steem.justyy.com had a stretch of 123 consecutive failed minutes today. Full per-tick view: node detail page.
Best vs worst performance gap
The fastest node was 10.55× faster than the slowest today (71 ms vs 749 ms). Previous-week reference is not yet available; the trend line will appear in future reports.
Visual detail
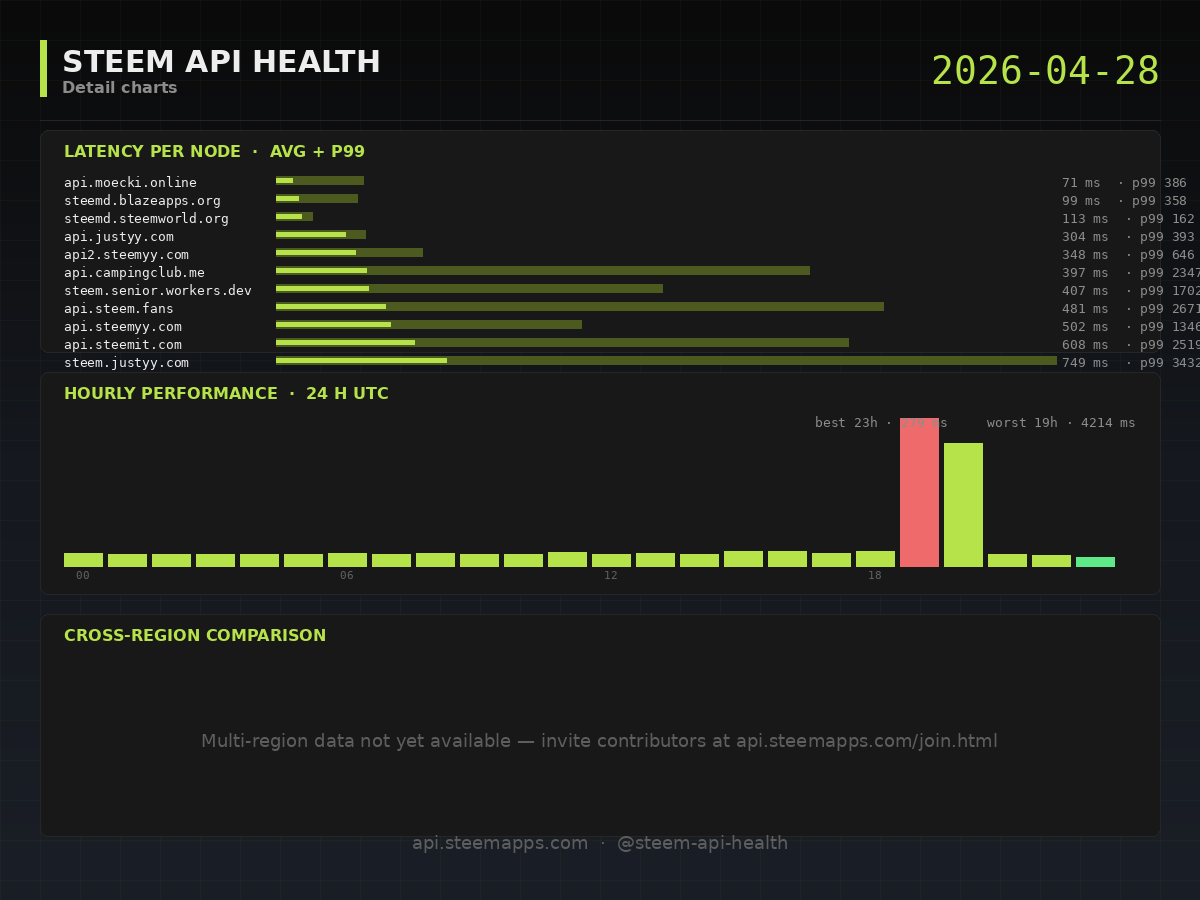
Top: latency distribution per node. Middle: hourly performance. Bottom: cross-region comparison (when multi-source data is available).
Methodology: one condenser_api.get_dynamic_global_properties request per node every 60 seconds, 8-second timeout. Full rules and thresholds in MEASUREMENT-METHODOLOGY.
Want to make these reports more accurate?
Anyone can contribute measurements from their own server. The participant script runs in Docker (3 commands to install) and helps build a global view of node performance.
- Participant script and instructions: https://github.com/greece-lover/steemapps-monitor/tree/main/participant
- Full participation guide: https://github.com/greece-lover/steemapps-monitor/blob/main/docs/PARTICIPATE.md
- Request an API key: visit https://api.steemapps.com/join.html — fully automated, takes about 2 minutes.
Contributors get attribution on the Sources page.
Feedback wanted
Have ideas for additional metrics, views, or analyses you'd like to see? Leave a comment below — the report format is still evolving and your input shapes future versions.
Resources
- Live dashboard: https://api.steemapps.com
- API documentation: https://github.com/greece-lover/steemapps-monitor/blob/main/docs/API.md
- Source code: https://github.com/greece-lover/steemapps-monitor
- Methodology: https://github.com/greece-lover/steemapps-monitor/blob/main/docs/MEASUREMENT-METHODOLOGY.md
- Raw data of this report:
custom_jsonoperationsteemapps_api_stats_daily, transactionf774c4ad634632d4118ae4fa73bef0ee570fc434in block22228 - Reporter account: @steem-api-health
- Operated by: @greece-lover (witness vote: https://steemitwallet.com/~witnesses)
Measurement window: 2026-04-28T00:00:00Z — 2026-04-29T00:00:00Z. Source location: contabo-de-1.