Steem API Health — Daily Report 2026-06-20
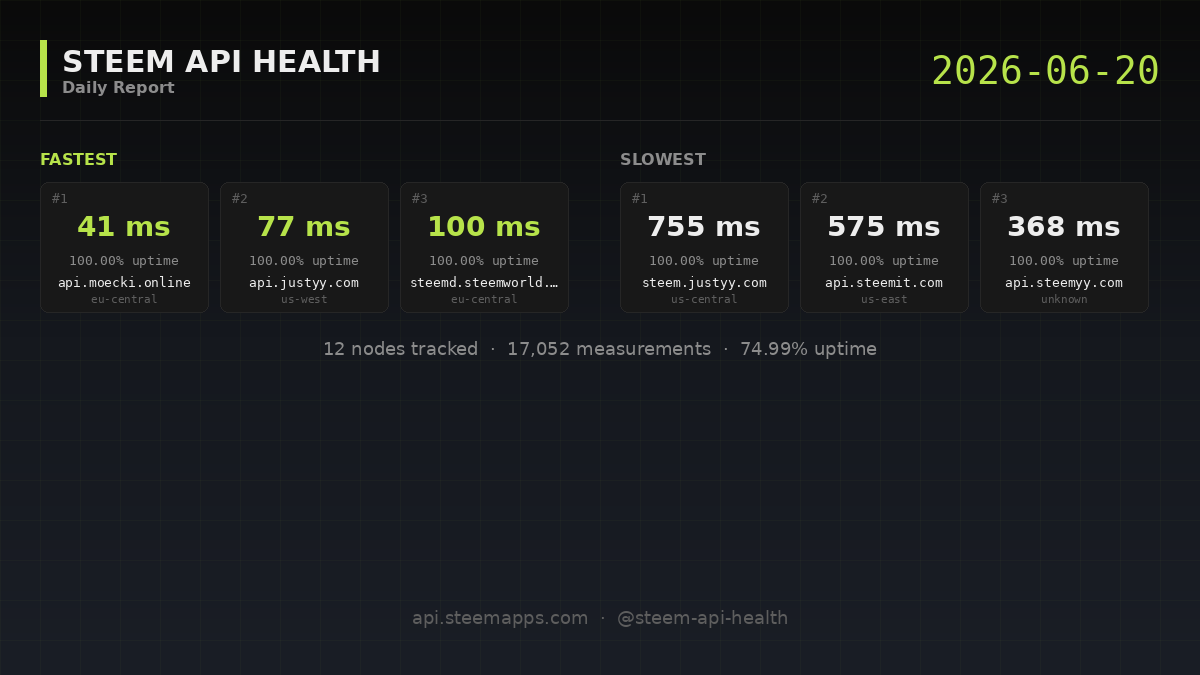
On 2026-06-20 (UTC) the monitor tracked 12 Steem API nodes with a global uptime of 74.99% across 17,052 measurements. Median latency across all nodes: 132 ms. Today's full picture and notable patterns below.
All measurements are taken from a single European location (Germany). Latency to nodes hosted outside Europe will naturally be higher than for users connecting from those regions. Want to contribute measurements from your region? See the participation block below.
Observations
- Longest outage today:
api.campingclub.me, 1421 consecutive failed minutes. - Fastest node:
api.moecki.onlineat 41 ms average. That is 218 ms below the fleet average of 259 ms across 9 nodes. - Slowest node:
steem.justyy.comat 755 ms average. That is 496 ms above the fleet average of 259 ms. - Consistent leader:
api.justyy.comhas been in the top 3 by latency every day this week. - Consistent leader:
api.moecki.onlinehas been in the top 3 by latency every day this week. - Consistent leader:
steemd.steemworld.orghas been in the top 3 by latency every day this week. - Consistent laggard:
api.steemit.comhas been in the bottom 3 by latency every day this week. - Consistent laggard:
api.steemyy.comhas been in the bottom 3 by latency every day this week. - Consistent laggard:
steem.justyy.comhas been in the bottom 3 by latency every day this week.
Nodes
| Node | Region | Uptime | Avg | p50 | p95 | p99 | Errors | Error classes |
|---|---|---|---|---|---|---|---|---|
api.moecki.online | eu-central | 100.00 % | 41 ms | 39 ms | 58 ms | 89 ms | 0 | — |
api.justyy.com | us-west | 100.00 % | 77 ms | 67 ms | 90 ms | 344 ms | 0 | — |
steemd.steemworld.org | eu-central | 100.00 % | 100 ms | 100 ms | 104 ms | 123 ms | 0 | — |
steem.senior.workers.dev | global | 100.00 % | 131 ms | 128 ms | 177 ms | 231 ms | 0 | — |
api2.steemyy.com | global | 100.00 % | 155 ms | 143 ms | 249 ms | 404 ms | 0 | — |
api.steemyy.com | unknown | 100.00 % | 368 ms | 307 ms | 750 ms | 1163 ms | 0 | — |
api.steemit.com | us-east | 100.00 % | 575 ms | 556 ms | 831 ms | 860 ms | 0 | — |
steem.justyy.com | us-central | 100.00 % | 755 ms | 670 ms | 1066 ms | 2689 ms | 0 | — |
api3.justyy.com | asia | 99.93 % | 132 ms | 113 ms | 203 ms | 262 ms | 1 | rpc_error ×1 |
api.campingclub.me | asia | 0.00 % | — | — | — | — | 1421 | connect_error ×1421 |
api.steem.fans | asia | 0.00 % | — | — | — | — | 1421 | http_5xx ×1, rpc_error ×1420 |
steemd.blazeapps.org | eu-central | 0.00 % | — | — | — | — | 1421 | http_5xx ×1421 |
Latency distribution
Across 12,788 successful measurements today: 64.0 % under 200 ms, 76.2 % under 500 ms, 99.0 % under 1 000 ms. (1.0 % were slower than 1 second.)
Time-of-day pattern
Best hour today: 22:00–23:00 UTC (avg latency 243 ms, 531 measurements). Worst hour: 00:00–01:00 UTC (avg latency 275 ms, 531 measurements).
Error pattern
Most common error today: http_5xx (33.3 %), followed by connect_error (33.3 %), followed by rpc_error (33.3 %) (of 4,264 total errors).
Biggest outage of the day
api.campingclub.me had a stretch of 1421 consecutive failed minutes today. Full per-tick view: node detail page.
Week over week
Week-over-week: current week 74.89 %, previous week 74.91 % (Δ -0.02 pp).
| Node | Δ uptime |
|---|---|
api.steemyy.com | -0.81 pp |
api.steemit.com | -0.02 pp |
api.steem.fans | ±0.00 pp |
api.campingclub.me | ±0.00 pp |
steemd.blazeapps.org | ±0.00 pp |
api.justyy.com | +0.01 pp |
steemd.steemworld.org | +0.01 pp |
steem.justyy.com | +0.03 pp |
steem.senior.workers.dev | +0.06 pp |
api3.justyy.com | +0.12 pp |
api.moecki.online | +0.14 pp |
api2.steemyy.com | +0.16 pp |
Best vs worst performance gap
The fastest node was 18.41× faster than the slowest today (41 ms vs 755 ms). Last week the same factor was 11.50× — the gap is widening.
30-day reliability ranking
Most reliable
steemd.steemworld.org— 100.00 %
api.moecki.online— 99.94 %
api.justyy.com— 99.92 %
Least reliable
steemd.blazeapps.org— 0.00 %
api.steem.fans— 11.87 %
api.campingclub.me— 45.56 %
Longest unbroken uptime streak: steemd.steemworld.org — 18 days without a single failed tick.
Visual detail
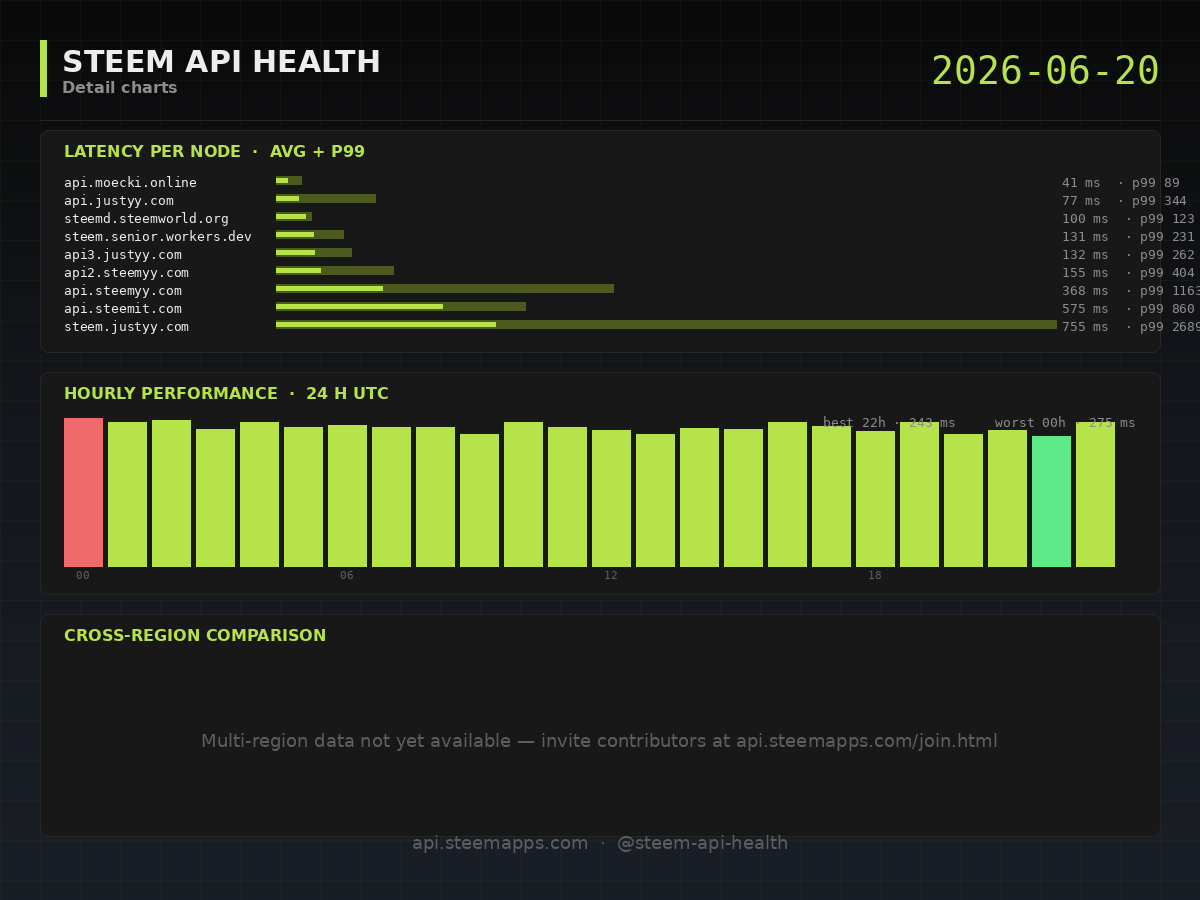
Top: latency distribution per node. Middle: hourly performance. Bottom: cross-region comparison (when multi-source data is available).
Methodology: one condenser_api.get_dynamic_global_properties request per node every 60 seconds, 8-second timeout. Full rules and thresholds in MEASUREMENT-METHODOLOGY.
Want to make these reports more accurate?
Anyone can contribute measurements from their own server. The participant script runs in Docker (3 commands to install) and helps build a global view of node performance.
- Participant script and instructions: https://github.com/greece-lover/steemapps-monitor/tree/main/participant
- Full participation guide: https://github.com/greece-lover/steemapps-monitor/blob/main/docs/PARTICIPATE.md
- Request an API key: visit https://api.steemapps.com/join.html — fully automated, takes about 2 minutes.
Contributors get attribution on the Sources page.
Feedback wanted
Have ideas for additional metrics, views, or analyses you'd like to see? Leave a comment below — the report format is still evolving and your input shapes future versions.
Resources
- Live dashboard: https://api.steemapps.com
- API documentation: https://github.com/greece-lover/steemapps-monitor/blob/main/docs/API.md
- Source code: https://github.com/greece-lover/steemapps-monitor
- Methodology: https://github.com/greece-lover/steemapps-monitor/blob/main/docs/MEASUREMENT-METHODOLOGY.md
- Raw data of this report:
custom_jsonoperationsteemapps_api_stats_daily, transactioneaf3f4bdab98c8396538fe09b03aeb8803b1ab5bin block36154 - Reporter account: @steem-api-health
- Operated by: @greece-lover (witness vote: https://steemitwallet.com/~witnesses)
Measurement window: 2026-06-20T00:00:00Z — 2026-06-21T00:00:00Z. Source location: contabo-de-1.