Weekly Steem Stats Report - July 10, 2017
Welcome to my Weekly Steem Stats Report for Monday, July 10, 2017. All data is coming directly from the Steem blockchain and is based on UTC time.
From now on, I'll publish a weekly stats report instead of a daily report every Monday.
It's interesting the number of posts was lower last week, while the number of votes was higher. On average, each post received more votes last week.
1. Weekly number of Posts (including comments)

| Date | Posts |
|---|---|
| 201727 | 852,571 |
| 201726 | 976,399 |
| 201725 | 808,004 |
| 201724 | 572,741 |
| 201723 | 428,461 |
| 201722 | 262,535 |
| 201721 | 256,161 |

2. Weekly number of votes

| Date | Votes |
|---|---|
| 201727 | 1,937,757 |
| 201726 | 1,910,964 |
| 201725 | 1,904,070 |
| 201724 | 1,733,898 |
| 201723 | 1,422,894 |
| 201722 | 958,227 |
| 201721 | 1,025,789 |
3. Posts + Comments per post
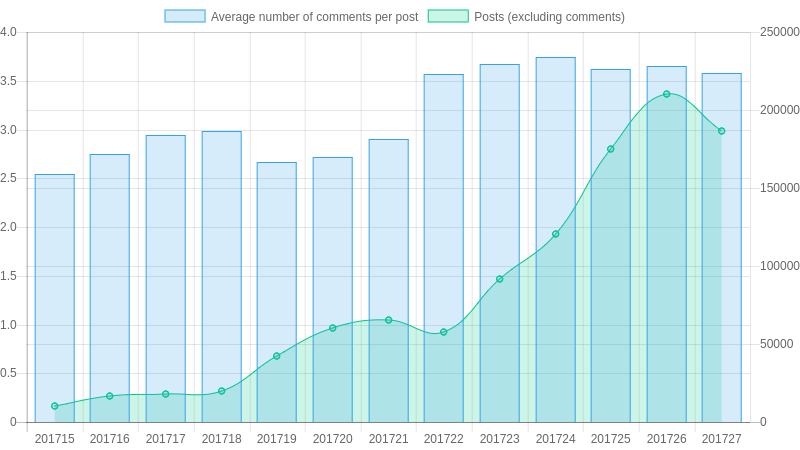
| Date | Average # comments |
|---|---|
| 201727 | 3.58 |
| 201726 | 3.65 |
| 201725 | 3.62 |
| 201724 | 3.74 |
| 201723 | 3.67 |
| 201722 | 3.57 |
| 201721 | 2.90 |
4. New accounts created
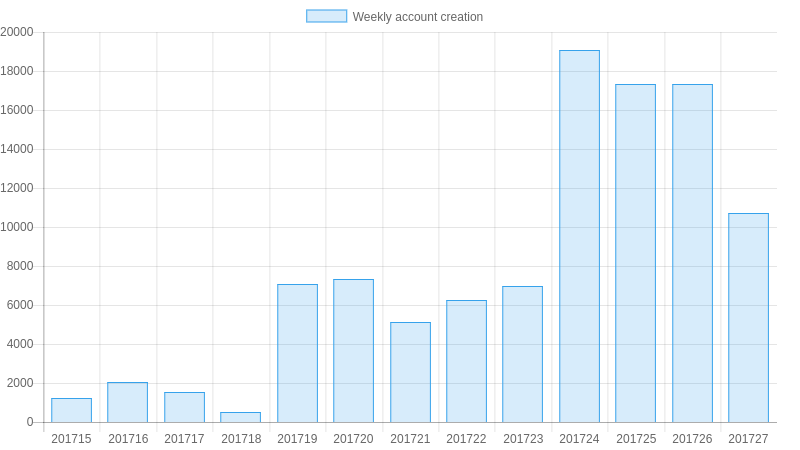
| Date | New Accounts |
|---|---|
| 201727 | 10,698 |
| 201726 | 17,353 |
| 201725 | 17,322 |
| 201724 | 19,072 |
| 201723 | 6,985 |
| 201722 | 6,250 |
| 201721 | 5,130 |
5. Weekly Amount of SBD converted to Steem
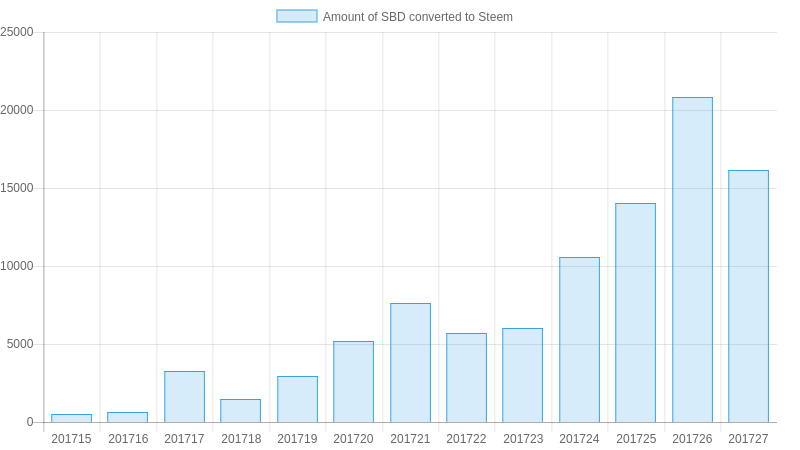
| Date | Amount in SBD |
|---|---|
| 201727 | 16,156.954 SBD |
| 201726 | 20,851.761 SBD |
| 201725 | 14,021.673 SBD |
| 201724 | 10,572.907 SBD |
| 201723 | 6,005.578 SBD |
| 201722 | 5,690.260 SBD |
| 201721 | 7,606.681 SBD |
6. Weekly Amount of Steem Powered UP
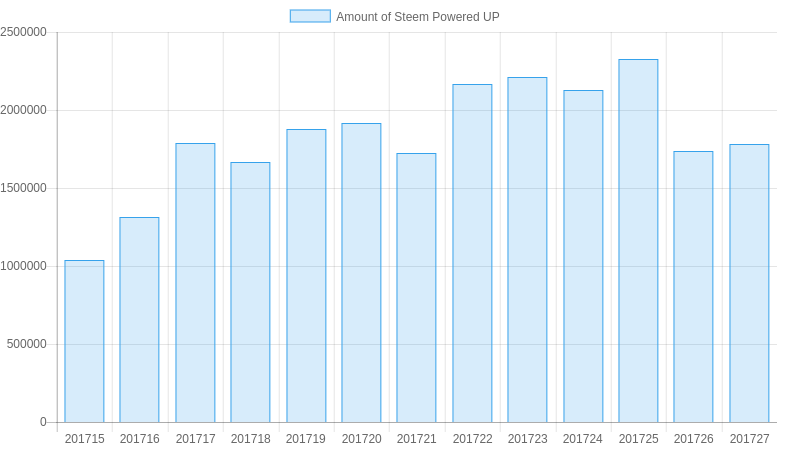
| Date | Steem |
|---|---|
| 201727 | 1,784,698.688 STEEM |
| 201726 | 1,739,809.746 STEEM |
| 201725 | 2,328,395.460 STEEM |
| 201724 | 2,128,881.014 STEEM |
| 201723 | 2,214,476.203 STEEM |
| 201722 | 2,169,195.354 STEEM |
| 201721 | 1,725,340.166 STEEM |
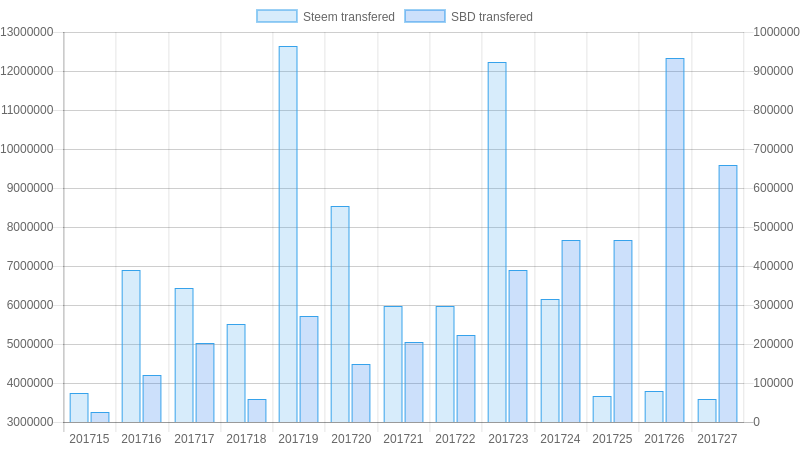
7. Weekly Steem & SBD Transfers
| Date | Steem | SBD |
|---|---|---|
| 201727 | 3,592,993.320 STEEM | 659,503.437 SBD |
| 201726 | 3,798,055.393 STEEM | 933,402.011 SBD |
| 201725 | 3,655,019.450 STEEM | 465,504.810 SBD |
| 201724 | 6,143,653.407 STEEM | 467,103.596 SBD |
| 201723 | 12,240,053.631 STEEM | 388,531.815 SBD |
| 201722 | 5,982,073.145 STEEM | 222,584.447 SBD |
| 201721 | 5,968,843.903 STEEM | 205,944.235 SBD |
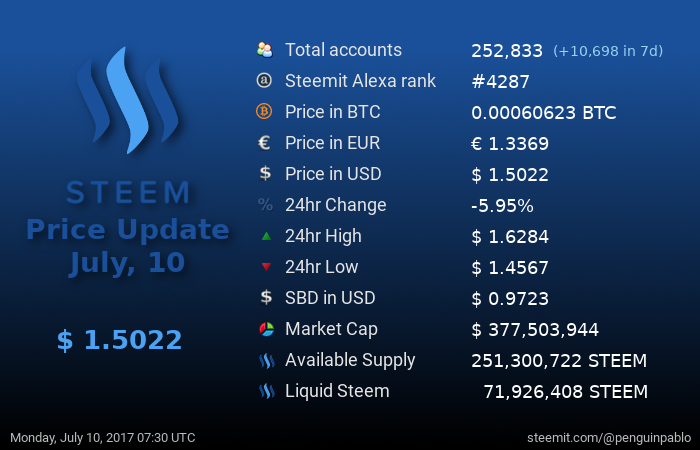
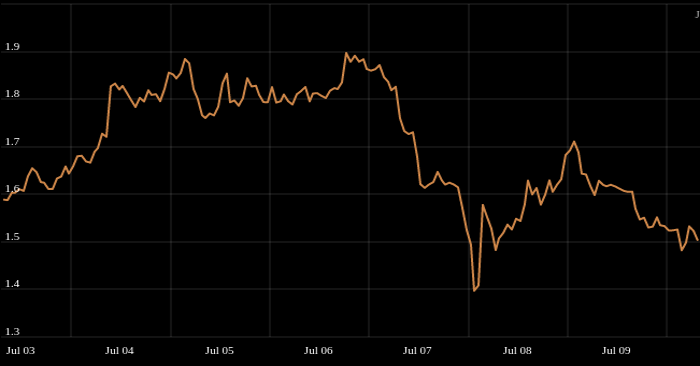
8. Steem Price Update
I am seeing a slow growth period in coming days until bitcoin fud is cleared and then we will see boom in all cryptos and steem will rock it.
Holy crap what's with the uptick this week? There seems to be something wrong with your dates.
Also please add a longer time frame at the bottom for reference, weekly time frame can show too many anomalies
I forgot to explain the meaning of the date fields. It's in the YYYYWW format. For example: 201724 is week 24 in 2017.
Ah my mistake completely misunderstood. I knew steemit was growing well but this is amazing. These longer time frame graphs are exactly what I was looking for, followed
I'd say Steemit is alive and well despite the recent downward trend in Steem prices. Thanks for the great info.
All look perfectly here but I do not understand why the steem price is falling so drastically.
Seems we are now seeing a decline this week compared to a massive growth last week. The market trend says it all.
some interesting information thank you - the new accounts created graph looks great :)
Steemit cant stop growing :D
Seems steemit is progressing really well! Thank you for the info!
Steemit.com doubling the web traffic 2 months in a row, exponential growth!
(I know it is not 100% accurate data, but it is still very indicative.)
Thanks for all your hard work. Two things. One, SteemNow.com is amazing! Two, a stat many of us are interested in seeing is the Average Weekly Payout for minnows. And of course, dolphins, orcas, and whales as well. Would be great to compare how we are all doing. Not sure if it is possible to track but it would be awesome to know things like that.