STEEM and SBD supplies after week 3 of SPS burning [burnsteem100]
For previous weeks, see:
As with last week's post, I don't see any surprises in the numbers or charts. The SBD supply and haircut price continue to decline while the STEEM supply, virtual supply, and collateralized supply are continuing on their baseline trend.
The haircut price has dropped from about $0.152 at the start of proposal #116 to $0.141 today. My baseline expectation for the haircut price was $0.138 when the proposal finishes, and that still seems like a reasonable guess with ~7-8 days left.
Based on today's median STEEM price and haircut price, we would expect SBDs to be valued at $0.545, and the external market value is $0.55. Right on target. (At the original haircut price, we'd have expected SBDs to be priced near $0.507, so we can speculate with some grounding that the burn has so-far added about 7% to the price of SBDs.)
So, let's get on to the pretty pictures:
Supply Sizes
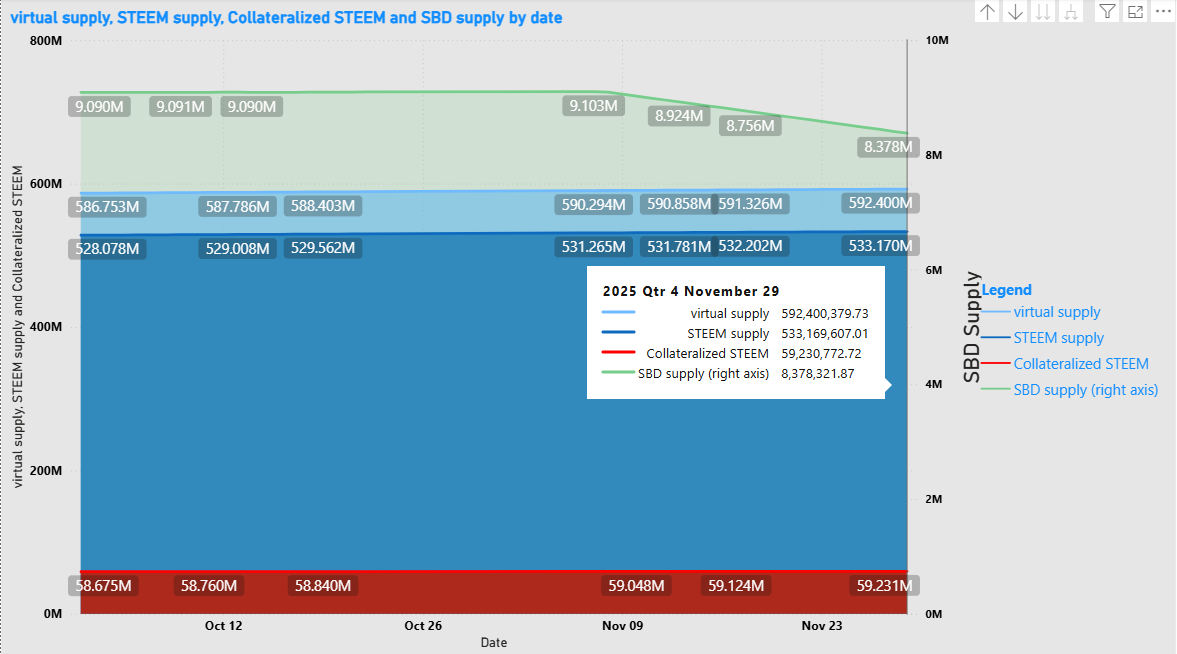
- The virtual supply, current size, and collateralized STEEM are all scaled against the left axis.
- Collateralized STEEM is not a real term. It's just something that I use as an aid for understanding. It's defined as
the virtual STEEM supply-the current STEEM supply. It's also the number of STEEM that the blockchain would have to create, if all SBD debt were magically cashed in at the current prices. - The SBD size is scaled against the right axis.
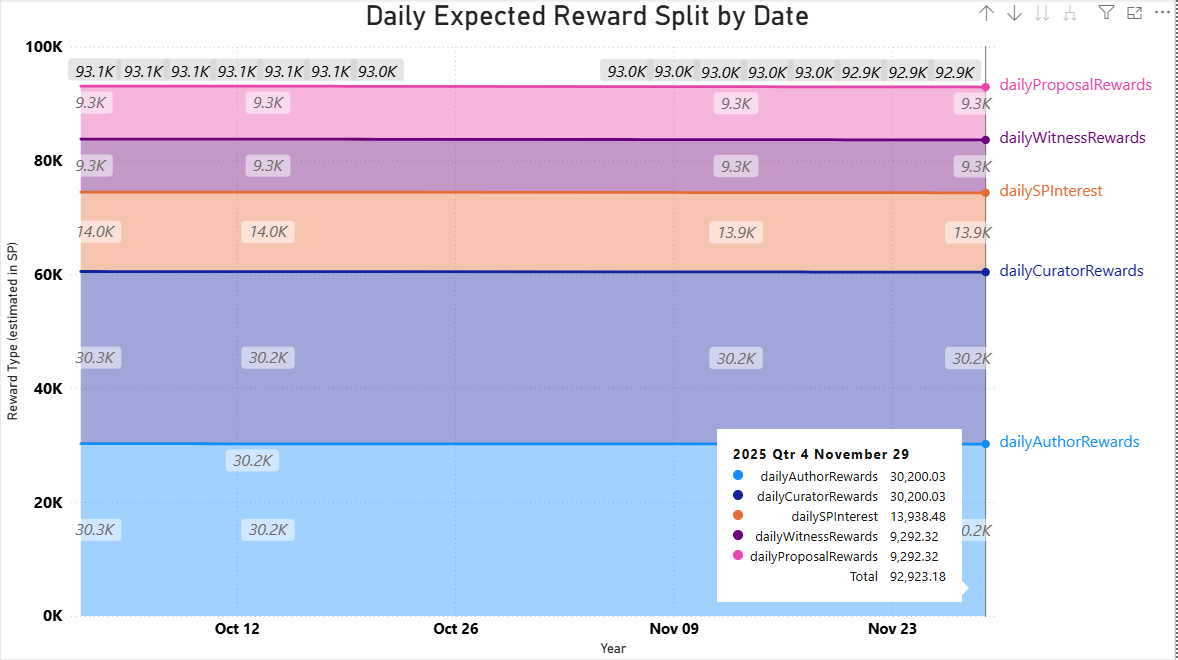
Expected daily new STEEM
new: Inflation observations vs. expectations
And, just for fun, since I created an automatic download and a new visual in Google Sheets, here's a graph of how supply growth and blockchain inflation are matching up against expectations.
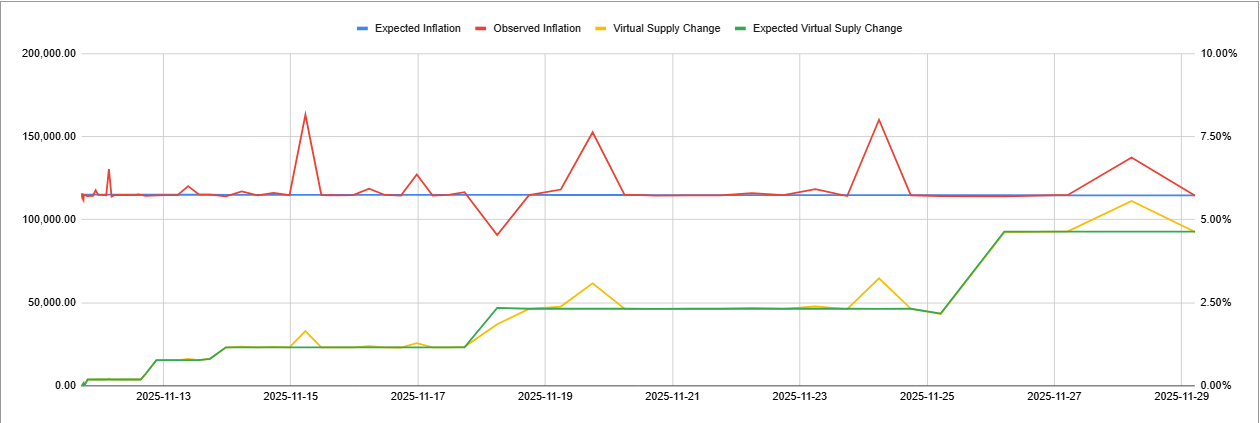
- Inflation percentages are scaled against the right axis.
- Virtual supply changes are scaled against the left axis.
- Ignore the apparent increase in the expected and observed supply (green and yellow lines).
- That's an artifact of the way I was collecting data. Before Nov. 26, I was doing more than one download per day.
- The point here is that the lines are moving together, not how high they are on the axis.
- I'll eventually start deleting days with multiple entries after I have enough days of new data to replace them.
- Ignore the apparent increase in the expected and observed supply (green and yellow lines).
- If the STEEM price and the haircut price flip, these axes will need to be increased - by a lot, and they will include negative values. This is because the increases and decreases will also reflect changes in the number of collateralized STEEM.
Update: Forgot about the DAO value charts.
SPS sizes
All available data
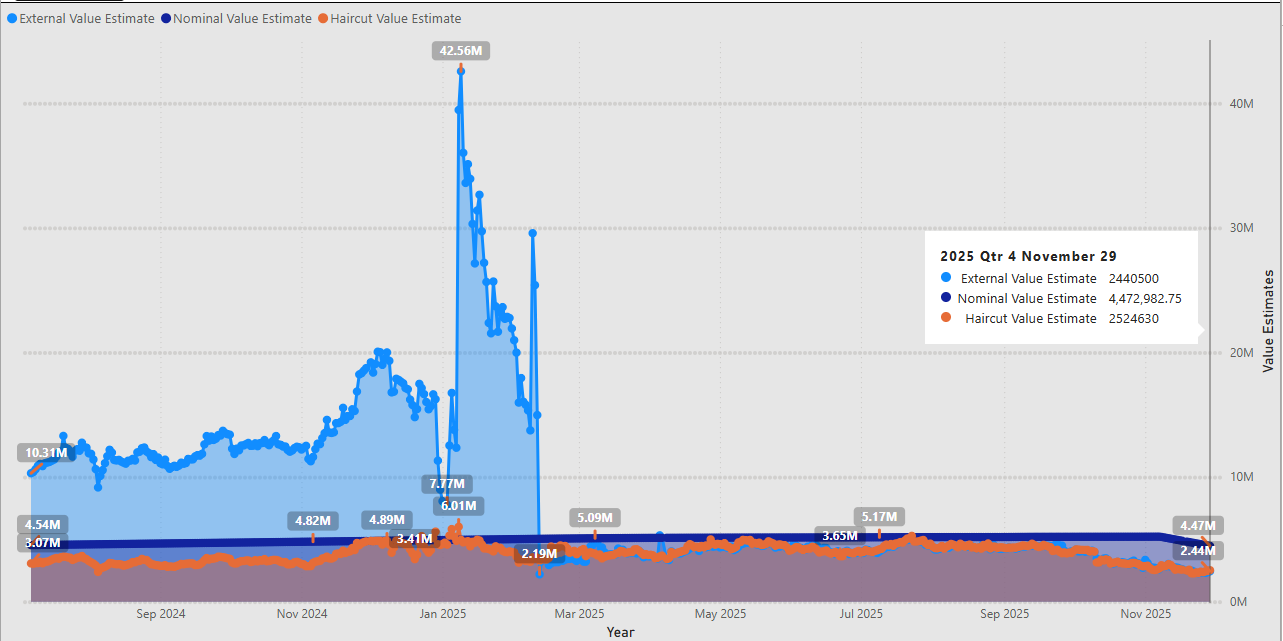
- Repeating from last week, the external value and the haircut value have been continuing to track closely together, ever since the Upbit delisting.
- It occurred to me this week that instead of describing SBDs as pegged to 1 USD, a better way to describe them is a sliding peg with a 1 USD ceiling (unless/until we find find and implement some sort of stabilization methodology).
After September 30 (Recent baseline + burn project)
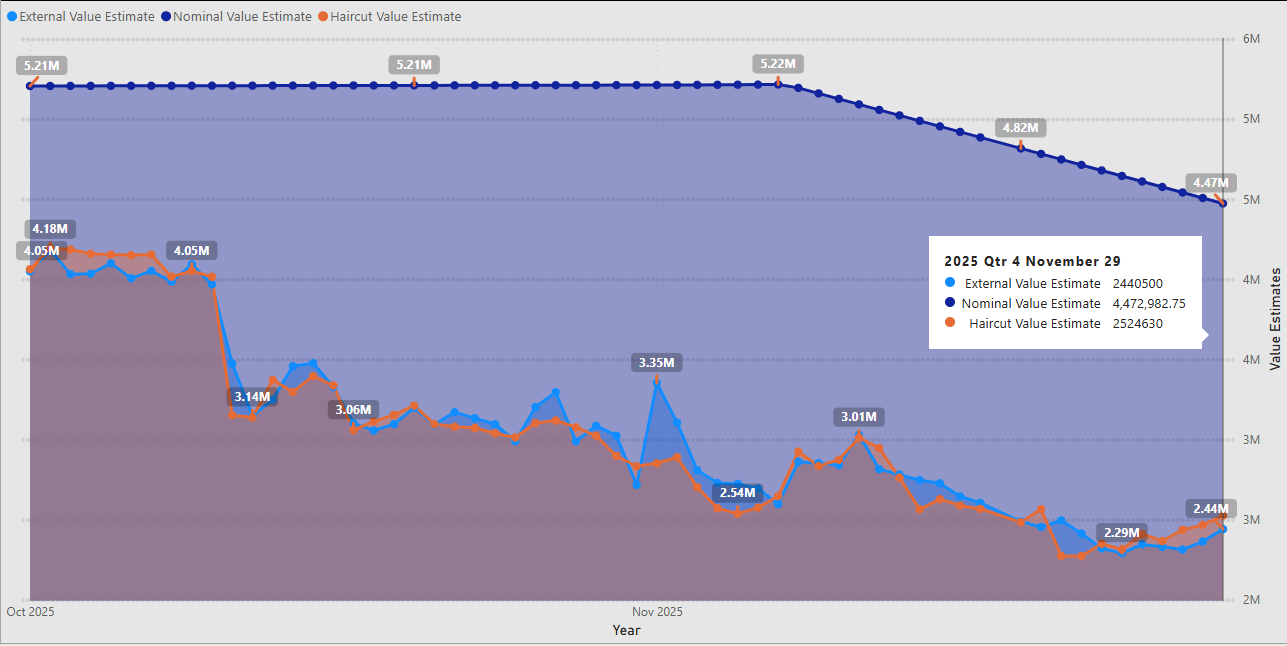
- The decreasing size of the purple area is clearly a result of the burn activity.
- IMO, the decreasing size of the orange and blue areas comes from the broader market downturn. Specifically, it's because the price of STEEM has declined (relatively faster than the haircut price).
- Also IMO, the blockchain is healthiest when all three of these values are the same.