Bitcoin's 2018 Journey Thus Far!!! - TeamCrypto Bitcoin Screening: $6,914 (1d chart)
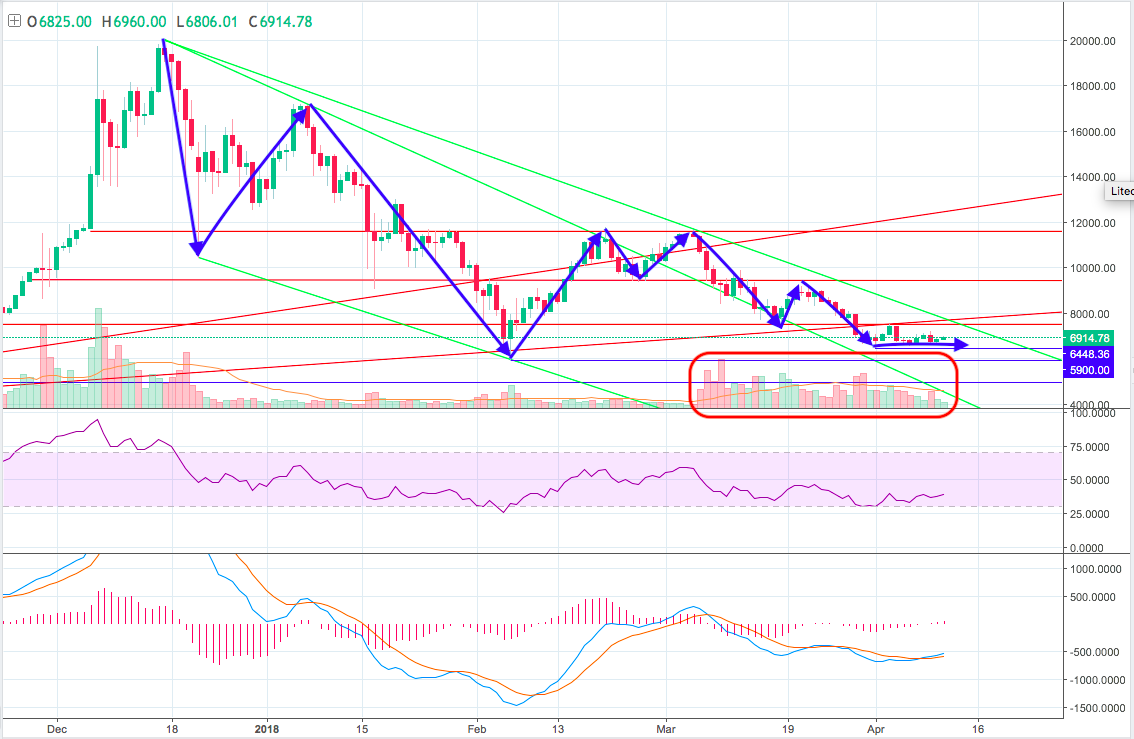
#Bitcoin has been in a consolidation period lately, so I thought it would be a good time to pull back the charts again to get a nice big-picture view. #BTC topped out around $20,000 on December 17, 2017. I have marked out its overall movement since then with blue arrows. Initially, just like when BTC first broke $10,000, there was a massive psychological sell-off. This one was much bigger, though, coming all the way down to almost $10,000 (that's nearly a 50% loss in about a week!). It had a very strong buy-back all the way up to about $17,000. This is when all the inexperienced were buying in (thinking Bitcoin survived and was going to $1M) and all the experienced began selling out (knowing what the inexperienced were thinking). This then began the panic selling of the inexperienced, and Bitcoin steadily dipped all the way to about $5,900 with many people losing lots of their money (not to mention the many lending/mining companies coming down too). Since then, FUD and regulation have dominated the markets. BTC/crypto believers began buying the dip, causing nice surges as high as about $11,700, but to no avail as negative news continued shaking out the weak hands. We tested this $11,700 #resistance twice, and the second rejection caused us to stumble down towards our lows again. Bitcoin has since dipped as low as about $6,400, but it has not retested our strong $5,900 level support. I was a firm believer that we would, but it's looking like BTC is creating a rather convincing bottom right now. Check out the #volume (red circle). To me, it looks like the #bulls are here to fight, and they are killing the #bearish momentum. The #RSI is to the bottom with an upward trajectory. The #MACD has narrowed out tremendously with a slightly #bullish direction. Check it out:
Now, assuming we maintain this sideways movement, we still have a few days for Bitcoin to reach our outermost bear trend resistance (green diagonal line). We would need to push through this, obviously. My two points that I want to see BTC break is, first, our $7,500 resistance and then, second, our $11,700 resistance. This second level has been our stumbling block to mooning. We need to break that before I am confident the official countdown can begin.
How about you all? What's your take on BTC's 2018 journey thus far? Agree? Disagree? I welcome dialogue!
