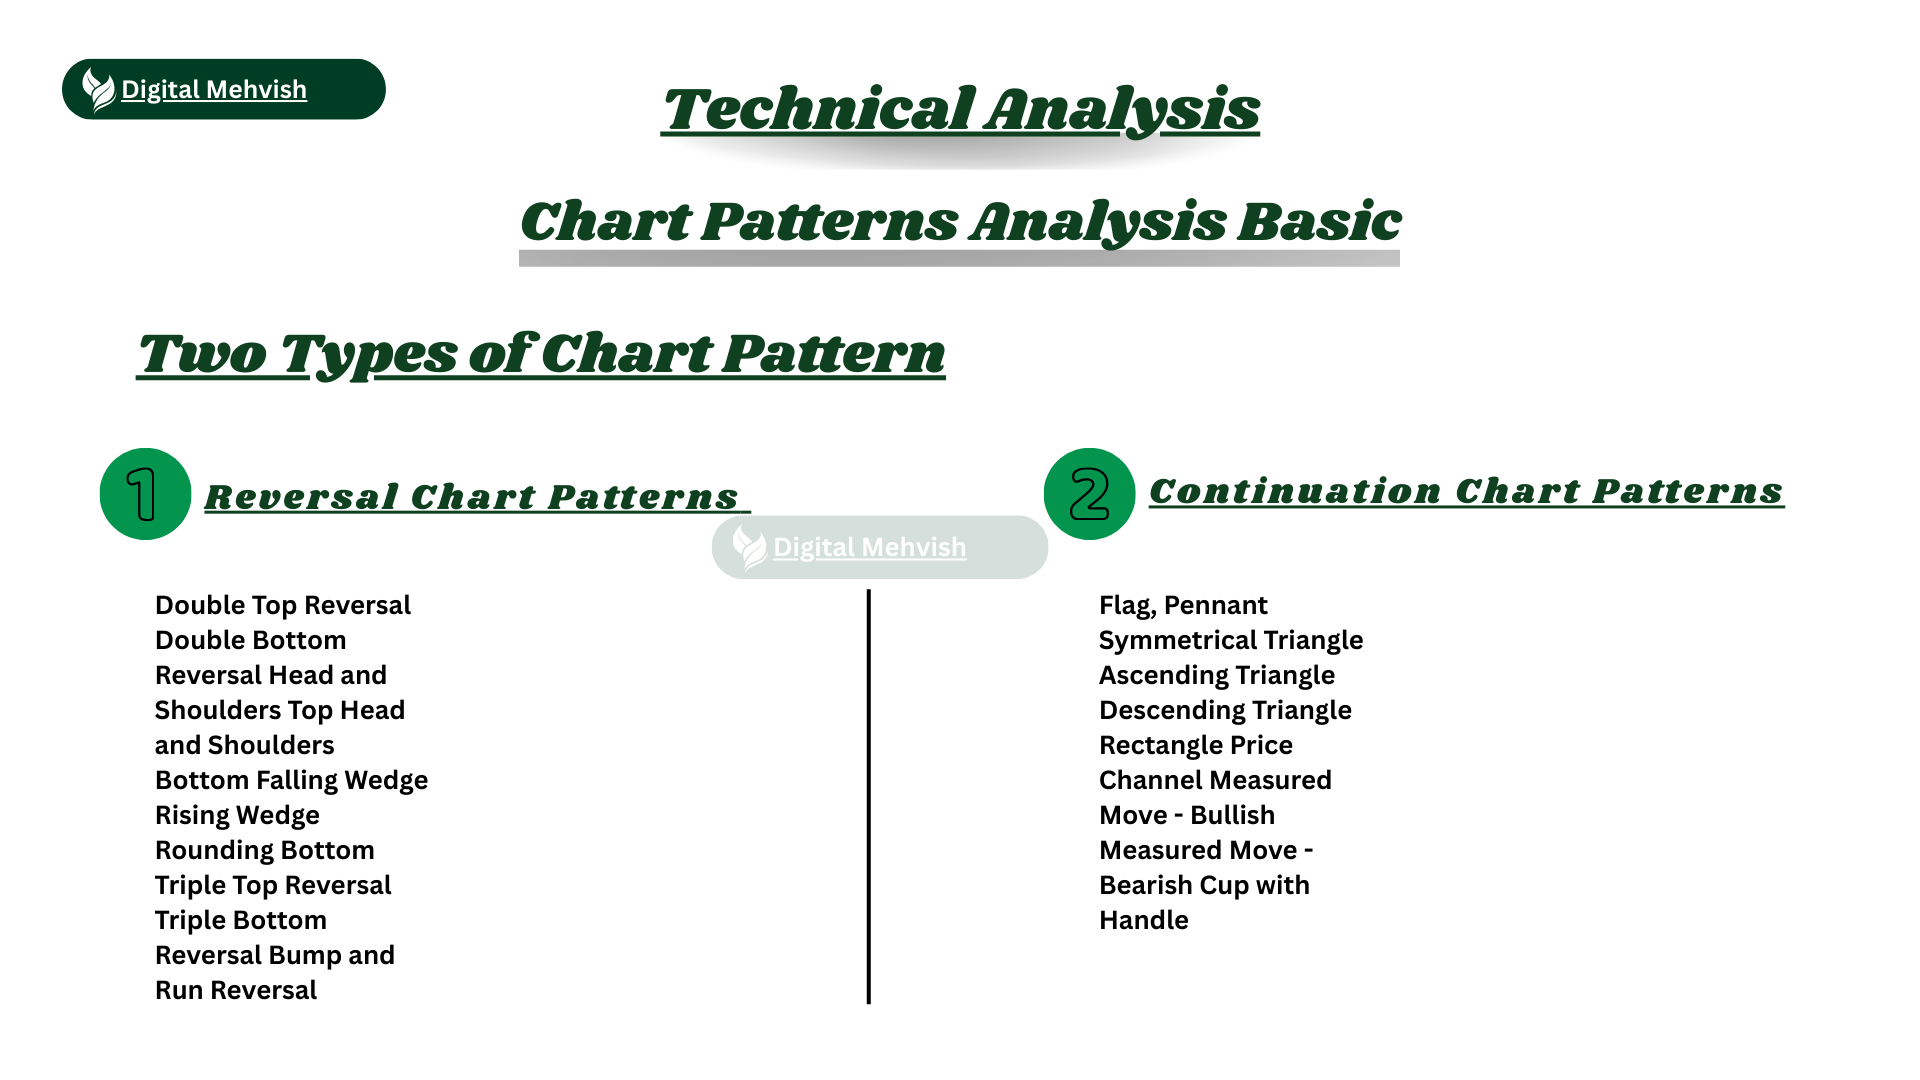
📊 Basic Chart Patterns (For Beginners)
Today I want to share a few basic chart patterns that are very common in technical analysis. These patterns help traders understand possible trend reversals in the market. I am explaining them in very simple words so beginners can easily understand.
.png)
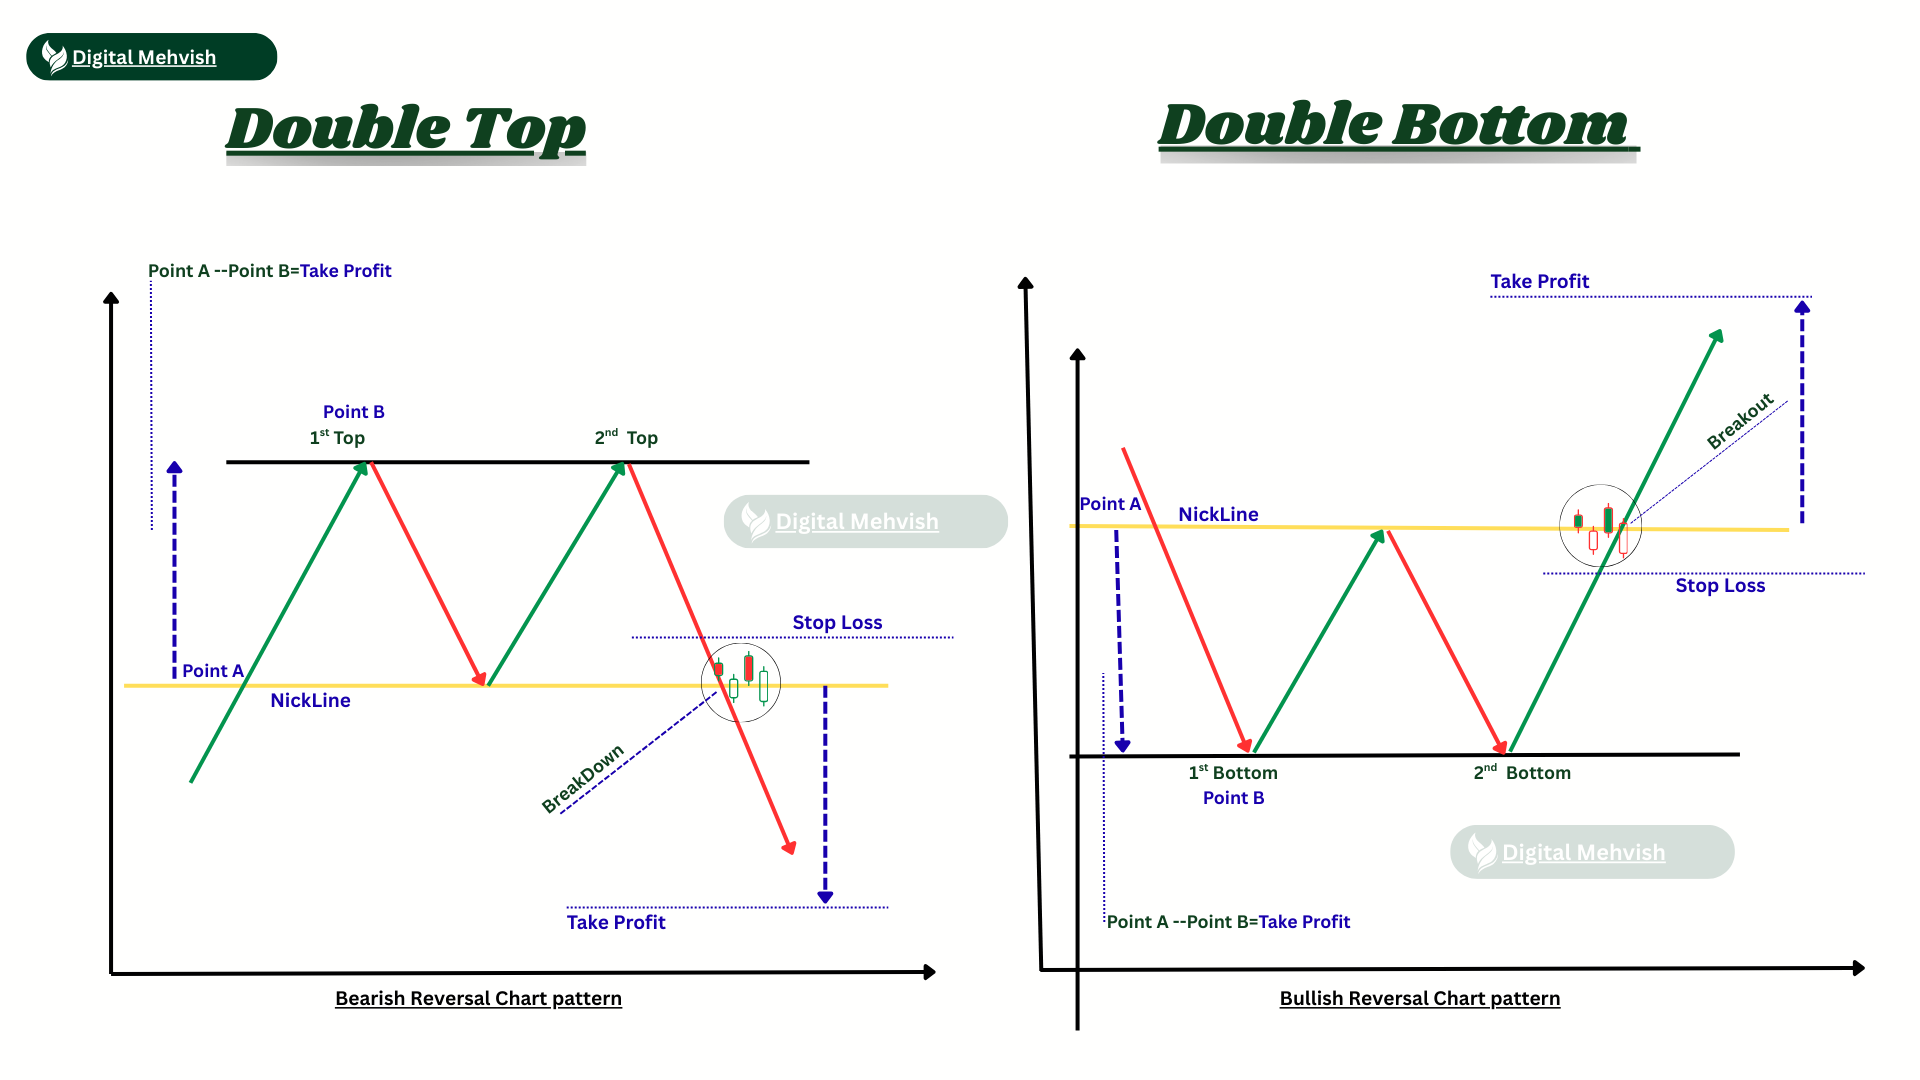
🔹 Double Top
The Double Top is a bearish reversal pattern.
It forms when price reaches the same resistance level two times and fails to break it. After the second top, price usually moves downward.
Appears after an uptrend
Neckline break confirms the pattern
Mostly used for sell setups
🔹 Double Bottom
The Double Bottom is a bullish reversal pattern.
Price touches a support level twice and fails to go lower. After breaking the neckline, price often moves upward.
Appears after a downtrend
Shows buying strength
Commonly used for buy entries
.png)
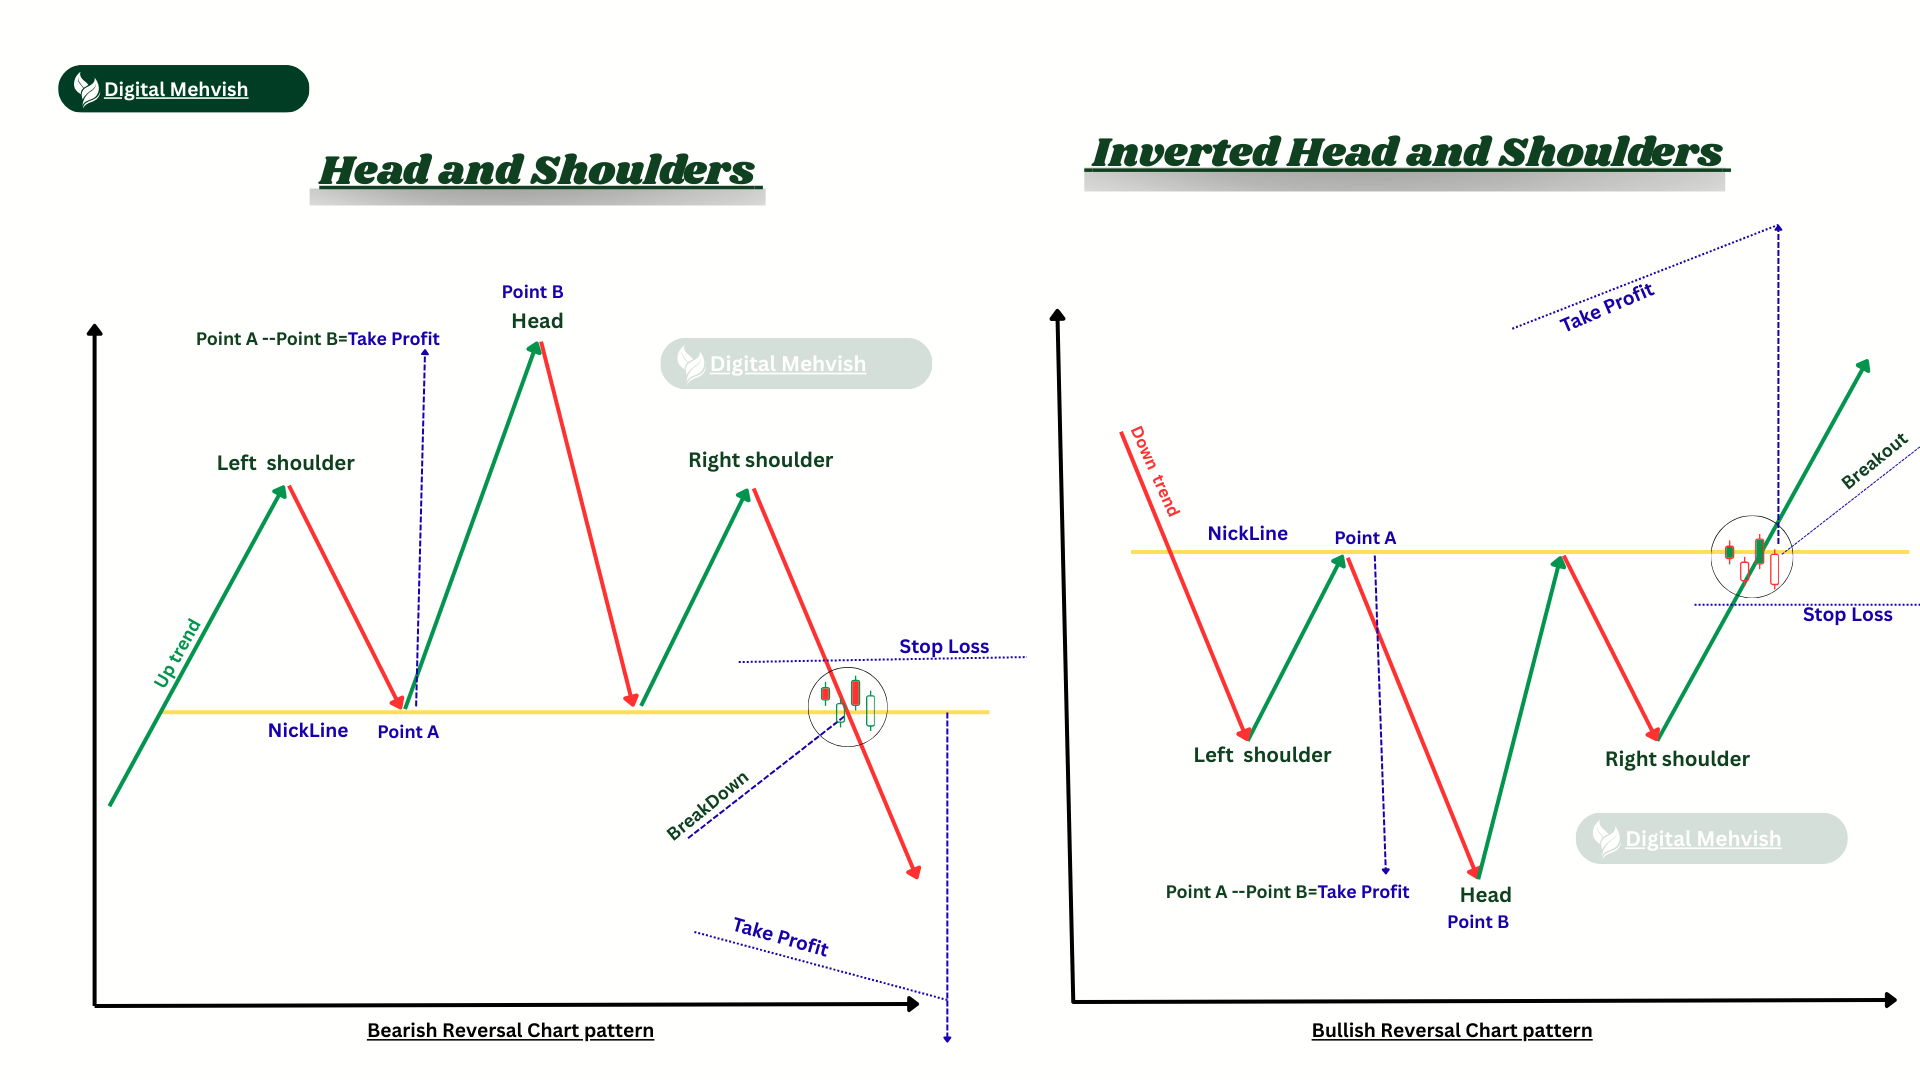
🔹 Head and Shoulders
This is one of the most reliable bearish reversal patterns.
It consists of three peaks:
Left shoulder
Head (higher peak)
Right shoulder
When price breaks the neckline, it usually signals a trend change from bullish to bearish.
🔹 Inverse Head and Shoulders
The Inverse Head and Shoulders is the opposite of the normal one.
It is a bullish reversal pattern and forms after a downtrend.
Three bottoms instead of tops
Middle bottom is the lowest
Neckline breakout gives buy confirmation
.png)
Chart patterns work best when combined with:
Proper stop loss
Risk management
Support and resistance
Do not rely on patterns alone. Always practice and learn step by step.