FOREX CANDLESTICK PATTERNS BASICS - KEY INFORMATION YOU NEED TO LEARN
To become a successful Forex trader, you need to learn about price action trading and candlestick patterns.
This involves analysing a candlestick chart that reflects the actions and beliefs of every market participant - both human and computer programs - as influenced by current events, market demands, and other essential deciding factors.
What is price action and why does it matter?
Price action trading looks at market movements on a price chart.
The chart movement reflects variables and exploits price indicators such as the Relative Strength Index (RSI) and Stochastic Oscillator. Some believe that price movements also reflect every price signal needed to create a profitable long-term trading system.
Simply put, you can look at price action as the money trail. It is mostly used by short-term traders who want to amplify their FX trading arsenal. Forex blogs suggest that by looking at price movement and market hotpoints like resistance and core support levels, you can effectively select points of entry that will most likely result in profitable trades.
To help you devise the right trading strategy, let’s deep dive into learning how you can read a price chart, most specifically, candlesticks analysis and patterns.
Forex Candlestick pattern basics - what you need to know
ThinkMarkets describes price charts as the heart of any trading market.
The chart allows you to keep track of your position's market value and check how the prices have changed over a certain period of time. It will also give you vital clues on possible price fluctuations.
The chart is comprised of the x and y-axis. The x-axis reflects time while the y-axis shows the currency pair price.
Also, depending on your view settings, you may see lines, bars or candlesticks. In most cases, FX traders prefer to use the forex candlestick patterns chart because it shows the four market price points:
- Open
- Close
- High
- Low
What are the different parts of forex candlestick charts?
Each candlestick is composed of three parts:
Upper shadow/wick - The vertical line above the real body that marks the opening time.
Real body - It's the wide part of the candlestick and represents the currency pair's price range from the opening and closing time of a trading schedule.
Lower shadow/tail - Another vertical line found below the real body that reflects the closing time of the day.
A candle turns green if the closing market price exceeds the opening price. If it’s the other way around, the candle colour will switch to red.
Aside from the colours of the candlesticks and the wick and tail positions, there are other things you need to learn so you can read candles effectively.
How to read candlestick chart for day trading
Take note that each candlestick represents a certain segment in time.
It summarizes all the trades made during that specific timeframe. As mentioned in the previous section, each candlestick has four price points.
The opening price refers to the first trade made for a given period while the closing price refers to the last trade. Both price points comprise a forex candlestick body. The high and open price points, on one hand, refers to the highest and lowest trading price available in the selected timeframe.
Candlestick patterns and the stories they tell
In order for you to create a solid price action trading strategy, you need to perform a candlesticks analysis. This will require you to asses entire the picture instead of just looking at a single candle.
You need to find any noticeable candlestick patterns that you can use as a trading signal.
A candlestick chart analysis will also require you to recognise a bullish or bearish pattern.
Bullish candle patterns - This type of pattern indicates a rise in currency pair prices. Bullish candles usually indicate buyers pressure.
Bearish candle patterns - This trend is mostly seen when the number of sellers exceeds the total number of buyers. Bearish candlesticks form when prices go down.
Besides classifying a candlestick as bullish or bearish, there are different patterns that you need to learn about such as the bullish engulfing pattern, bearish evening star and a bullish abandoned baby.
You can find more candlestick patterns explained with examples in our forex trading course and in the next few sections.
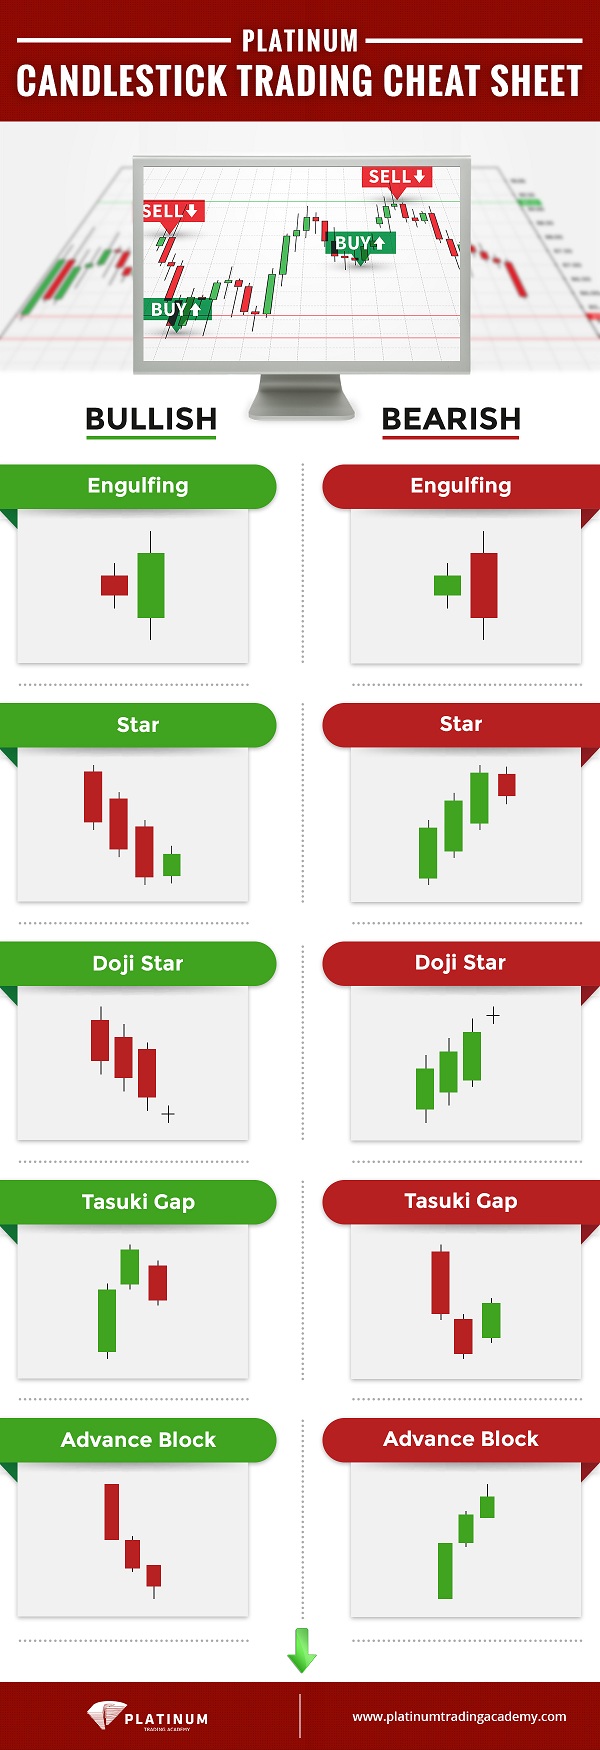
What are the basic forex candlestick patterns?
Candlesticks can either have long or short bodies. Most of the time, longer candlesticks reflect higher selling or buying pressure, while shorter candlesticks indicate very minimal price movement plus consolidation.
Noticing the length of the candle bodies is key to identifying patterns and determining whether to go for a long or short position.
Marubozu candlesticks
Unlike other candles, the Marubozu candlesticks do not have wicks. This type of continuation pattern indicates that the bears or bulls have full control of the FX market.
If you see a white or bullish Marubozu, it means that bears fail to push the currency pair price down, resulting in a high closing price.
If you see a red or bearish Marubozu, you should expect to see the bears push down the bulls and the candle to close at the lowest price point.
Seeing either a bearish or bullish Marubozu suggests that the trend will continue even on the next candlesticks.
Spinning tops
Spinning tops are characterised by a small body and long wicks and tails. This type of pattern reflects indecision.
Neither the bull or the bear succeeded in claiming victory, so the candlestick closes somewhere near to the open price point. This candlestick pattern indicator is very important because it can help you predict reversals.
Dojis
Dojis appear in candlestick pattern charts in various sizes and shapes.
You can immediately spot them because of the absence of a real body. Dojis tell you that the closing price is the same as the opening price. Like the spinning tops, dojis also indicate indecision and possibility of reversal.
You can try to watch forex trading videos to see how to use dojis, spinning tops, and Marubozu candles to create your day trading strategy.
What are reversal candle patterns?
There are many types of reversal patterns that you can read in other FX blogs including Hammer candlestick patterns and shooting star candlesticks.
Every type of reversal pattern indicates that a power transition between a bearish and a bullish candlestick is in play.
When a bear triumphs, you will observe a bearish candlestick pattern. If the same pattern continues for a long stretch of trading time, it indicates a bearish trend.
However, if you spot a spinning top in the market trend, this means that the FX currency pair is in an indecisive spot. It also suggests that the bears and bulls have equal power and that there may be a possible reversal.
What are forex trend lines?
Now that you're familiar with candles and candlestick patterns, we should look into another important component of a price chart - the trend line.
This line allows you to predict the possible direction of the price trend. Also, it can help you identify possible points of reversals as well as profitable entry points.
You should use the trend line as an additional tool to perform technical analysis and formulate your day trading strategy.
Like the FX candlesticks, trend lines are also classified as bullish or bearish. The easiest way to determine if a trend line is bearish or bullish is to look at the slope. If it’s positive, then it’s bullish. Conversely, if the slope is negative, the line is bearish.
How to draw a trend line?
To draw a trend line, identify two low or high swing points on the graph. Then, you should draw a line to connect them together. Lastly, you need to wait for a third low or high swing point to establish the trend.
To draw a trend line, identify two low or high swing points on the graph. Then, you should draw a line to connect them together. Lastly, you need to wait for a third low or high swing point to establish the trend.
BabyPips warns that if you draw a steep line, you will most likely see the trend quite fast.
Steep trend lines are also quite unreliable. It’s best to double check the line you draw to avoid issues.
You can continue to extend the line as long as you see new swing points. A break in the trend line will signify the possible beginning of a new trend.
How do you use trend lines?
Now that you know how trend lines work and what they can possibly contribute to your day trading strategy, let’s take a closer look at how you can utilise them properly.
Trends can either connect significant price highs or lows in a price chart which creates a dynamic resistance. This indicates that as time progresses, the resistance or support price also changes.
For example, the support level tends to go up if you spot an uptrend in the chart while the resistance level plummets if you see an FX downtrend.
Take note that you should not use the trend line as the only factor in predicting a candlestick pattern or creating a trading strategy. You should always combine it with other tools.
So when should you avoid trading?
Forex trading requires a lot of patience, practice, and analysis. Without a proper understanding of how this financial market works, you’re putting yourself at risk of losing a lot of money.
Learning about price action trading and the different candlestick patterns is a good start. But there is other key information that you need to familiarise yourself with such as fund management and forex trading analysis.
Learn beyond FX trend lines and the candlestick chart when you enroll in our comprehensive Forex trading course. Check out the course outline today and become a successful FX trader!
Glad to see high quality content thanks https://9blz.com/spinning-top-candlestick-pattern/
As the largest financial market globally, the Forex market sees trillions of dollars circulating daily. Its decentralized nature enables electronic over-the-counter trading, providing participants the flexibility to engage from any location worldwide, 24 hours a day, except for weekends. Before delving into this market, it's essential to consult fbs broker review. I think this information will be useful for you!