Tesla Inc. technical analysis
Tesla Inc. broke, in 2013, the ascending pennant to the upside. After that, it had a great rally till TSLA hit the $ 290. From that point, it started trading sideways between $ 180 as a support and $ 290 as a resistance. Mid 2017, TSLA broke this big resistance and made a new all time high at $ 390 which is now the resistance. The former resistance of $ 290, acts now as a support which has been tested several times.
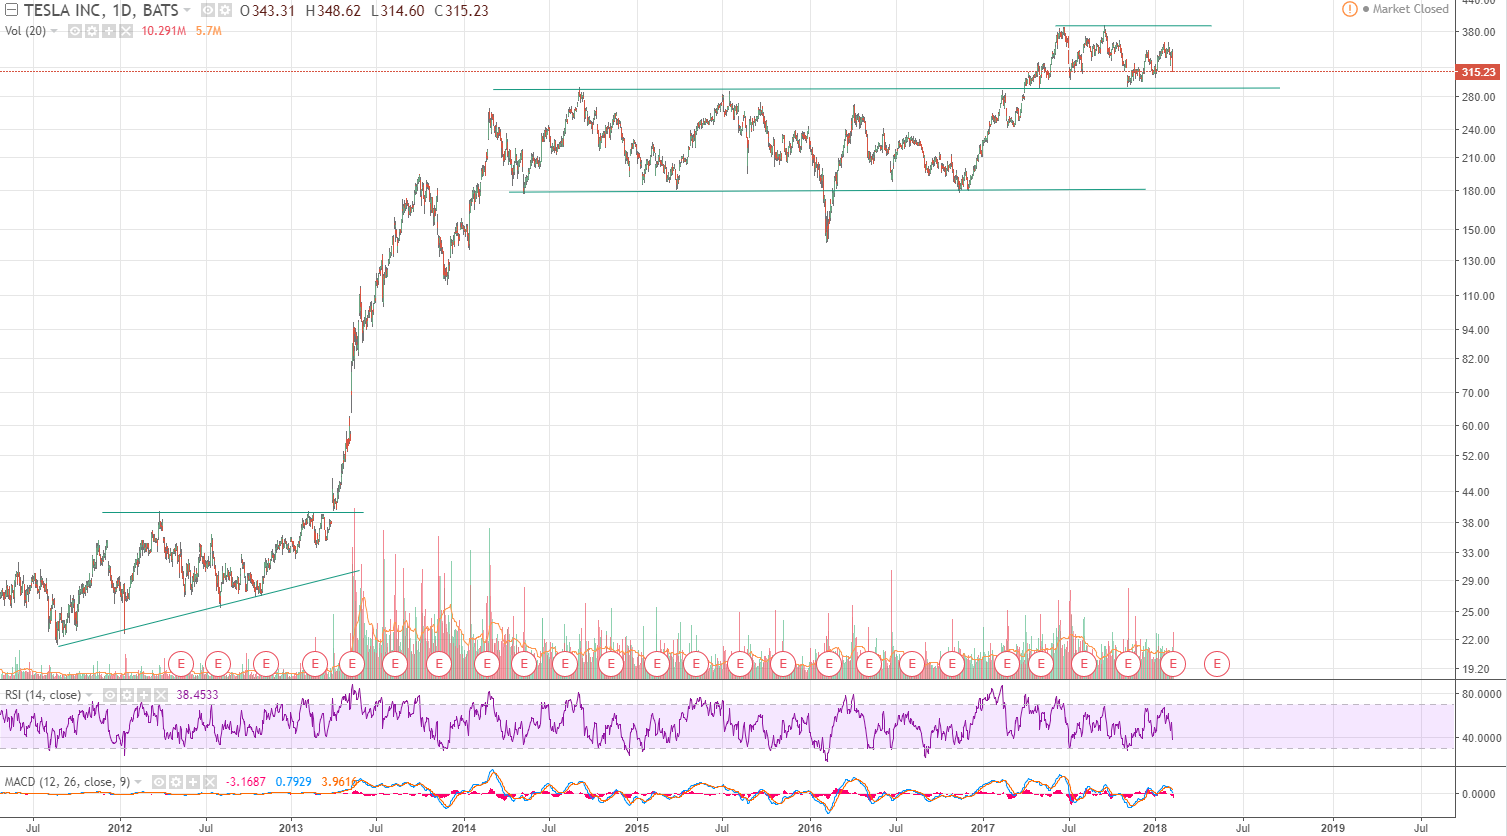
The daily RSI is 38.5 which is closer to the oversold area than the overbought area. At the beginning of this week, the MACD crossed over to the negative side which is bearish.
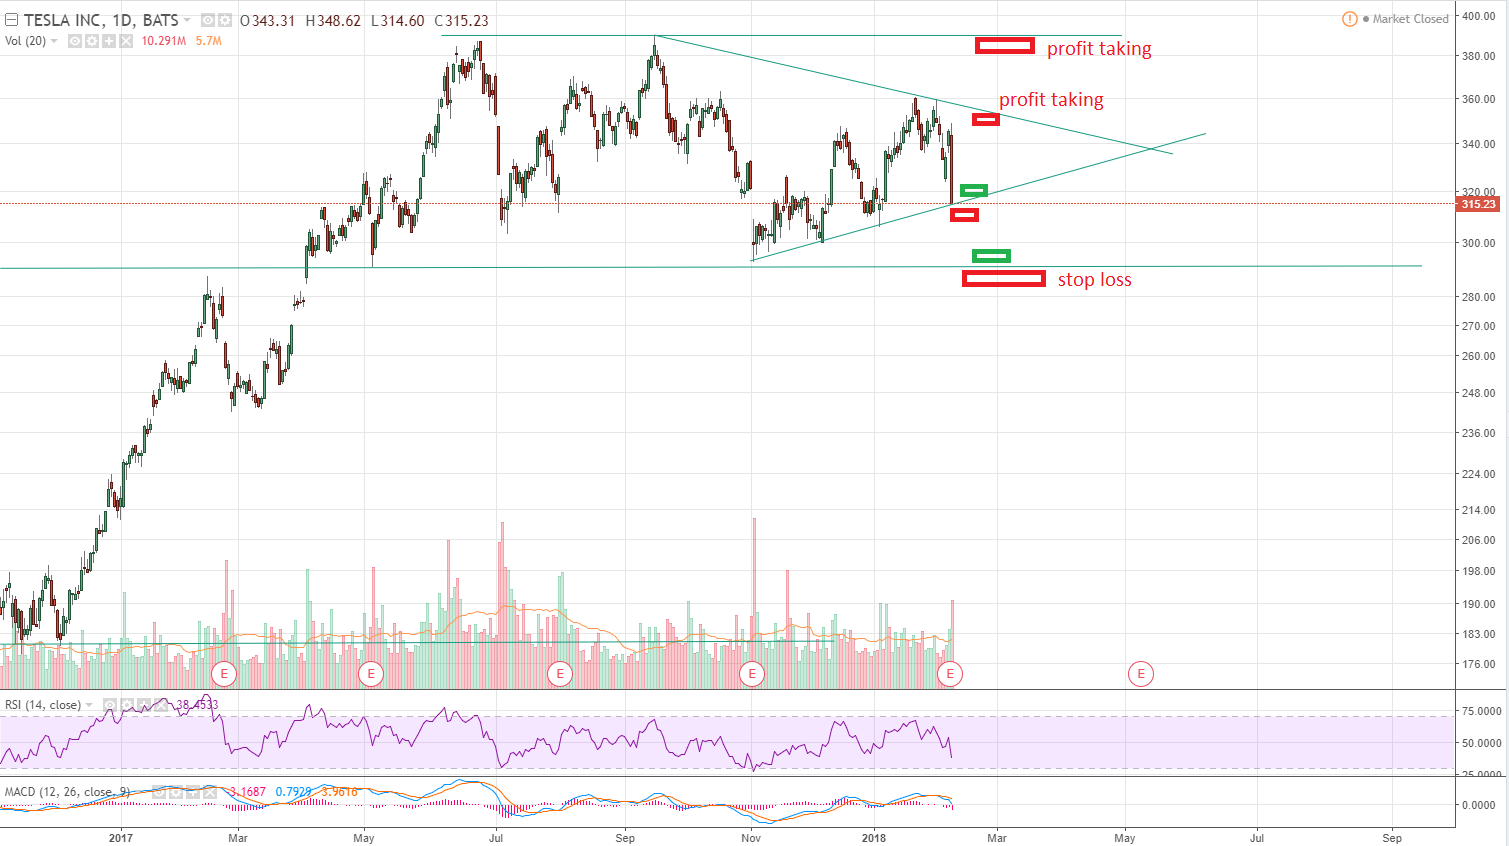
If we look a little closer, you can see that at this moment it is a great oppertunity to buy TSLA because it just closed the day on a support. If we bounce off the support, you might take profit at the $ 350 and the $ 385 level. If TSLA would drop, then you should pay attention to the $ 290 level. If TSLA would fall below $ 290, then there isn't much support till $ 243. The red rectangle is a selling area and a green rectangle is a buying area. The bigger the rectangle, the bigger the trade.
Disclaimer: This is not financial advise.
I just want to give my humble opinion on some products by doing technical analysis. There may be some minor and/or major flaws. Nobody is perfect and I'm willing to learn from my mistakes through your opinions. Thank you.
Money making posts:
https://steemit.com/money/@bo3ia/how-to-make-money-in-stocks-and-cryptocurrencies
https://steemit.com/money/@bo3ia/make-money-with-the-s-and-p500-index
https://steemit.com/cryptocurrency/@bo3ia/risk-management-in-cryptocurrency-and-stocks
Image source: https://www.tradingview.com/