market profile chart Nifty fut 20feb2024
Market profile chart Nifty fut 20feb2024
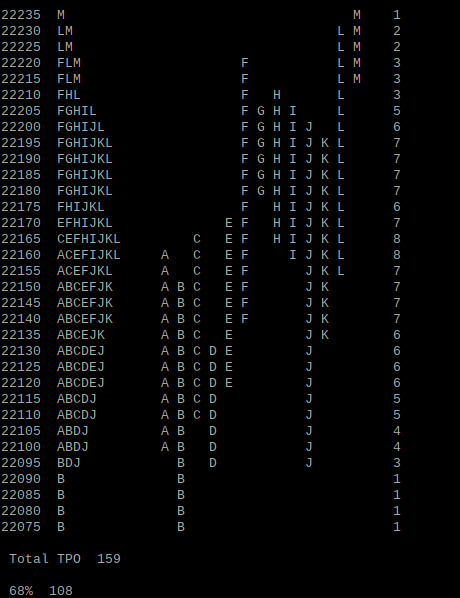
Open price at 09:15 : 22150.0
Last Closing price : 22231.95
Initial Balance High : 22158.55
Initial Balance Low : 22076.0
IB range : 82
TPO up: 65
TPO down: 81
if we see split profile we find C period exactly opened at halfback of B period which was immediately taken out D period and we also find E and F period opened in near the halfback of D and E from this we conclude that price moved by weak intraday traders and price has been inside the F period till G, H, I and it formed a poor high over there and from there price fallen down completely took stop loss of traders who entered in E and F period in J period and it continued it upwards journey cleared the poor high which formed in G,H,I and took the high and closed at a new high.
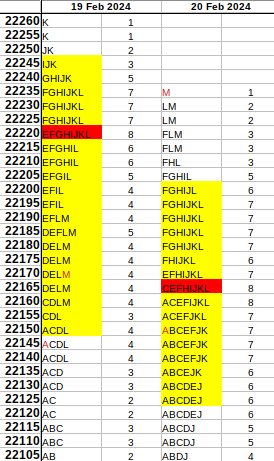
As we expected yesterday we formed an overlapping bearish value area and as of now market confidence with regards to close is above current day value area and also near vah of previous day value area which is somewhat positive with regards to close.