Sharing My trading Experiences - From 0 to Her0 #2
“Games are won by players who focus on the playing field – not by those whose eyes are glued to the scoreboard.” - Warren Buffet.
Photo by Negative Space from Pexels. source
Hello there Crypto-Tribals I really hope you are all having a great time on earth. If not, please make a self-examination because life is hard enough so we must make all we can to have a happy live no matter what.
Here we go to talk about trading again. This is a really never ending story. If you are not learning/practicing about trading you may not understand what the heck I am talking about but, believe me, as soon as you start digging into the financial stock market you will realise what I say.
Please let me invite to read the first article of this serie, just by doing click right here in this long line --------. So we can be in the same page. In the first post you may have a glintch about what all this serie is all about. I am sharing all my learning process for 2 main reasons:
- I share it to reinforce the knowledge I have. I am very visual so I learn and re-learn while writing all of this.
- I will share all I have been through so one day many people like you can save life time. Also all this material will be, possibly, a book in the future. Who knows.

Cortesy of Greenboxmarkets.com source
Japanese Candles
This is one type of graphic representation used by many platforms, traders, educators, etc., in order to get a visual image about the price of a stock, commodity, contract, crypto-currency or anything kind of instrument which can be bought and sold in the markets.
First Some basic concepts
- Price: is the amount of money of a determined instrument of trading.
- Instrument: is another adjective we can use to define an specific product which we can buy or sell within any market.
- Market: In this course we will refer to The Stock Market(known as the Old Wall Street) as the market but also the crypto-currencies market. The market is a place "virtual or physical" where we can trade goods or, as we said before: instruments.

Courtesy of Xm.com source
Types of Instruments within the Stock Market
- Stocks: The stock (also capital stock) of a corporation is all of the shares into which ownership of the corporation is divided. - source.
In example: Apple Inc have around 4,601,075,000 shares. Each shares represent a % of the ownership of the company. If you hold 460,107.5 shares it means you own the 0.01% of the company. Tip: some companies, projects, enterprises or entities, can offer dividends for each share a holder has.
- Stock Option: A stock option gives an investor the right, but not the obligation, to buy or sell a stock at an agreed upon price and date1. - source
Basically when you buy/sell and option, of any find of instrument, you are getting a contract for a specific date in which this contract will execute itself. Before that date you can hold it, buy/sell it. If the date comes is possible that you must buy those shares or whatever the contract has in it.
- Future Contract: A futures contract is a legal agreement to buy or sell a particular commodity or asset at a predetermined price at a specified time in the future. - source
In example: I have a company that produces Soy Souce. I will need to warranty a nice price for the next 6 months. So I go to the stock market and I buy $1,000,000 equivalent in Soy Beans because I "predict" the price is going up in certain dates(maybe when the harvester gets lower). It is better for me to buy cheap so in the next months I can use that contract maybe to sell some and after some period of time, execute them and buy that Soy.
- Commodity: A commodity is a basic good used in commerce that is interchangeable with other commodities of the same type. Commodities are most often used as inputs in the production of other goods or services. - source
Examples of Commodities: Today, tradable commodities fall into the following four categories: Metals (such as gold, silver, platinum, and copper) Energy (such as crude oil, heating oil, natural gas, and gasoline) Livestock and Meat (including lean hogs, pork bellies, live cattle, and feeder cattle). - source
Just not to extend myself to much, if you want to know more about other instruments please do some research. I will focus on some of the followings:
- The instruments itself is important just when you define something you like or an asset that fits perfectly with you capital. This is something we will touch in later posts.
- Every asset, stock, instrument, contract or commodity that can be showed in a visual way as a chart, will have many types of patterns that in most of the cases, this patterns will repeat over and over again. So finally the asset or the instrument is not the most important thing here.
- I will focus on Future's Contract because this is what I trade but you can choose anything you like as soon as you can handle: the volatility and the price to pay of that particular instrument.
This Whole Course will give you the bases to operate in the same way I do so this knowledge may be applied to any kind of stock, contract or asset.
1: Options give a trader the right to buy or sell a stock at an agreed-upon price and date. There are two types of options: Calls and Puts. One contract represents 100 shares of the underlying stock. - source
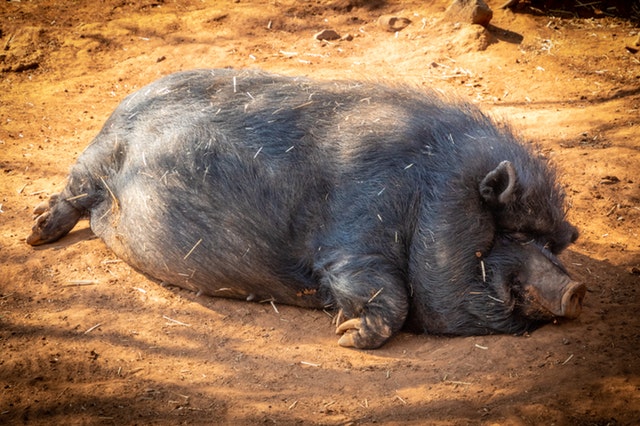
Photo by Magda Ehlers from Pexels source
Before continue with the Japanese "Stuff"
In Spanish Language we have a say:
"Cuando el Cochino es gordo, hasta el rabo es chicharrón". Rough translation: "When the Pig is fat even the tale is pork rinds".
So basically when the business is good, every little detail and aspect of it can make more money. In the case of the Pig, even the tale is food and very taste by the way. In the case of the Stock Market, every aspect: contracts, options os buy/sell, commodities, etc., they all are good to make more money and good to buy/sell for any time you like to make more money or in the worst case scenario to loose all the money you have.
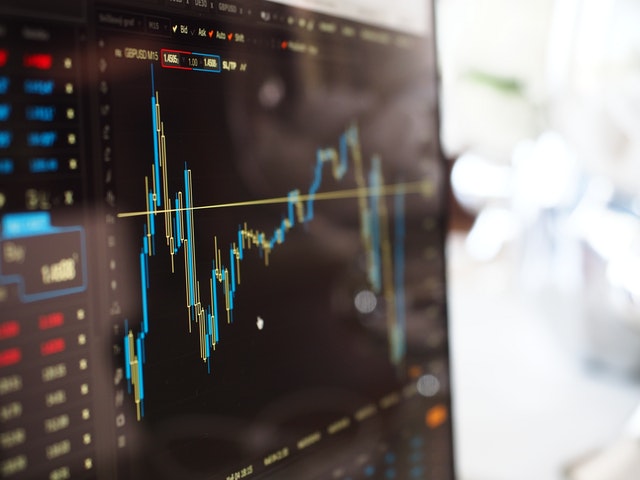
Photo by energepic.com from Pexels. source
Candles
A candlestick chart (also called Japanese candlestick chart) is a style of financial chart used to describe price movements of a security, derivative, or currency. Each "candlestick" typically shows one day, thus a one-month chart may show the 20 trading days as 20 "candlesticks".[1] Shorter intervals than one day are common on computer charts, longer are possible. - source
Basically with this representation we have a way to show what a price did and even what a price is doing in a very specific time frame. For example: in the following image we have a nice green candle who shows: "One day of the current price of Nasdaq Futures Contract". _From now on we will talk about this instrument as NQ and we will add the date in which this contract expires. For now If I say NQ 19-09 it means that we are talking about Nasdaq Futures Contract of September 2019.
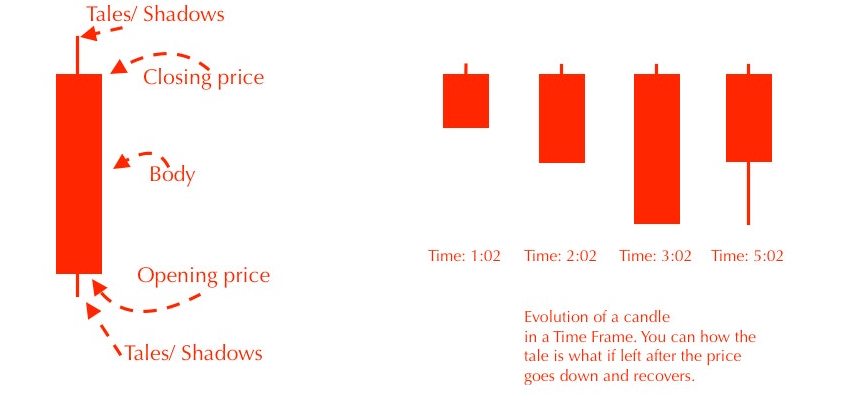
Take a look of the following image. We have a Red candle in 1 minute time frame. We can see roughly how it form itself. First appears as a green candle but then, starts going down because the price is going down. At the end we see a red candle which represents a negative price. In this case and in any red candle. The initial price is the one in the upper part of the candle's body. When I say the initial price is the price in which the candle starts. As the candle closed as red(negative) the final price is the one in the bottom part of the candle.
In some candles, the price goes up and then goes down. After doing this kind of "retracements" or "absorptions" it will leave a tale. This is very importan data that we will deepen later on.
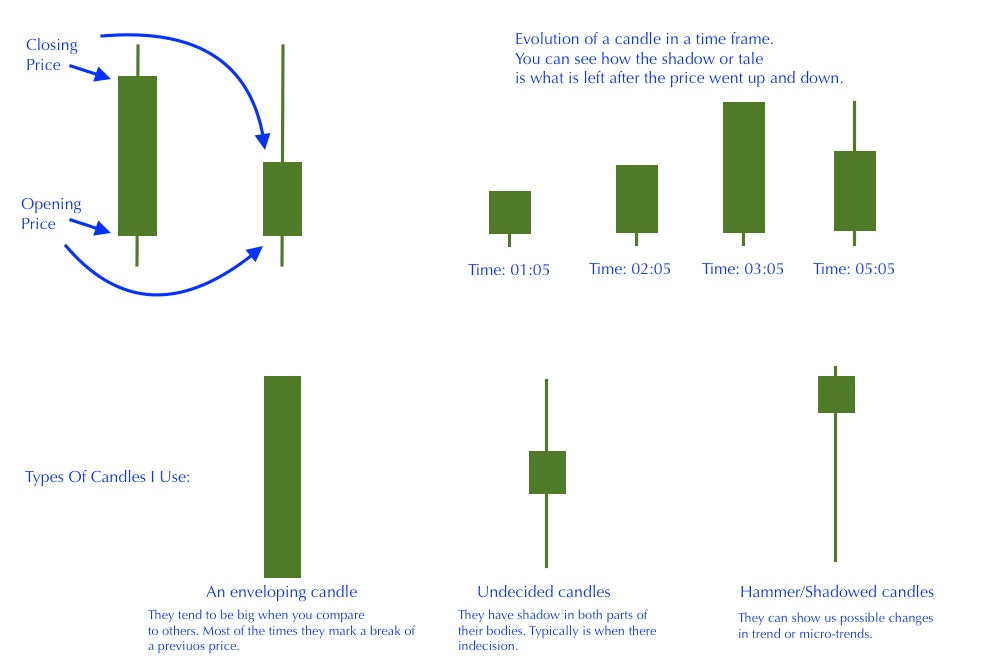
A Green candle must be read as follows:
- The opening price is the bottom part.
- The closing price is the upper part.
- The distance between the upper part and lower part is called the body of the candle. Tip: A candle's body can tells us if the buy or sell intention is strong or week.
A Red Candle must be read as follows:
- The Opening price is the lower part.
- The closing price is the upper part.
- The distance between them(upper & lower part)is called the body.
- The red and the green have opposites ways of reading.
HomeWork
If you really want to move forward in this trading stuff, go to the following Chart of NQ 09-19 and change the time frame of the chart to 1 minute.
- Go to the upper section where you may see an icon right next to the instrument's name "NQU2019". It can show you: D(for day time frame, where each candle represents a day) or 1m(for 1 minute time frame where each candle represents 1 minute).
- Optional: You may have to open a free account in Trading View.
- Identify a Japanese candle on the rise.
- Identify a Japanese candle in low.
The candles I use most - The red candles are the same but red - source
When the price goes down to a lower level, the candles shows Red - source
Types of candles
Depending of the way the a candles finish it form, we can have 3 types of candles:
- An enveloping candle. This type of candles are big when you compre it size with the others next to them. They basically envelope/cover the price of the other candles.
- Undecided candles. They are candles whom their bodies are small and they have almost the same amount of tale to the upper and to the down side. They look as something where the price is not decided yet to go somewhere.
- Tailed candles(also known as Hammers or shadow candles). They look like a big tale with some portion of a body. Too often they tells us about an absorption of the price. Is like an opposite force acting against another force and the strongest one wins and move the price, mostly to the opposite side of the tale. Tip: As much bigger the tail is, as much strong the move of the price will be.
I deeply ask you to do not get too confuse about many types of candles that there is out there. Remember these days there is too much information and it depends on us to keep the trading simple. If you really want to deepen into the candles I suggest read this book: "Japanese Candlestick Charting Techniques". But honestly we do not need to complicate ourselves while trading. This is something you will learn by yourself(if you are disciplined and consisten enough) from time to time.
Those 3 types of candles are more than enough to start understanding what the market is telling us.
Price & Time
So if we are in the same page we can understand than a price when is being shown in a Japanese candle's chart, it will start in a specific time and it will finish to form an specific type of candle after some time. This time is defined by us, the traders or the analysts by any kind of software.
- Many softwares have one indicator called "Bar Timer". This is essential so we can see when a candle it will finish its form and when a new candle will start.
- Some of the most used trading platforms have this. Please do some research, depending on which platform you want to start with. I recommend you Ninjatrader but this is a windows based software. In future posts I will show you step by step to install it even if you are a Mac user like me.
- Every candle will form itself in a specific time frame. If we use a Monthly Chart this means one candle represent 1 month of the price movement. If you want please start some experiments using Trading View.
Well guys this is for now. I don't want to extend myself into too much material. Keep you brain healthy for now because you will need it for later on. Peace OUT.
=========
For the next posts:
2. Candles Patterns.
2.1. Trends. How to confirm a trend - The wrong way and the best way.
2.2. Shall we go with the trend or against it?
2.3. Common Entry points in patterns.
2.4. Common exit points in patterns.
2.5. Resistance levels & Support Levels.
==========
Сейчас, стал очень модным побарный анализ.
Интересно услышать ваше мнение, по этому поводу.
Спасибо друг. Это правда Технический анализ и торговля очень модны. У меня есть время, чтобы узнать об этом, и поэтому я хочу предложить очень реальную и полную точку зрения. Понимание рынков требует большого терпения, тяжелой работы, большой практики и, прежде всего, понимания того, что делают институциональные трейдеры.
PD: Перевод с помощью Google-переводчик. Я надеюсь, что это понято. И спасибо за комментирование.
Спасибо, за ответ.
Через переводчик все понятно.
Буду ждать, других ваших сообщений.
saludos que recuerdos me trajo verte y revisar mi steemit...
Congratulations @theghost1980! You have completed the following achievement on the Steem blockchain and have been rewarded with new badge(s) :
You can view your badges on your Steem Board and compare to others on the Steem Ranking
If you no longer want to receive notifications, reply to this comment with the word
STOPVote for @Steemitboard as a witness to get one more award and increased upvotes!
Greetings dear friend @theghost1980.
This publication is a great piece of information. Incredibly complete and well documented.
The final analogy with the "candles" was very exemplifying.
Thanks for sharing with us.
P.S.
Since you seem to have some decent knowledge and experience, would you mind if I ask you to share your own opinion on my latest publication:
"DID OUR" WORLD LEADERS "JUST PUSH GLOBAL RECESSION AWAY from our doorsteps?"
https://www.steemleo.com/economy/@crypto.piotr/did-our-world-leaders-just-push-global-recession-away-from-our-doorsteps
I would appreciate it greately.
Yours
Piotr
Your level lowered and you are now a Red Fish!
Vote for @Steemitboard as a witness to get one more award and increased upvotes!
Congratulations @theghost1980! You received a personal award!
You can view your badges on your Steem Board and compare to others on the Steem Ranking
Vote for @Steemitboard as a witness to get one more award and increased upvotes!
Hola amigo!!
Soy @anasuleidy y pertenezco al equipo de Representantes de Venezuela, es para mi un gusto visitarte y saludar, siendo oportuno resaltar que en mis visitas a tu blog, he evidenciado que te encuentras inactivo, teniendo mucho tiempo sin realizar publicaciones inclusive. Es por ello que te invito a reincorporarte y activarte en la plataforma, las cosas han cambiado mucho por aquí y seria genial volver a contar contigo.
Todos estaremos atento y a la espera de tu regreso.
Saludos!!