Trading The US30
Hey Fam Bam :)
I decided to take a small account ($30 AUD) and turn it into a much larger account.
I will be trading on Metatrader 4 and for the first time trading the US30.
The US 30 is the top 30 US companies I believe and how they are performing. I don't actually care too much about what the 30 companies are doing, but rather the chart!
Lets do a top down analysis, starting from the monthly.
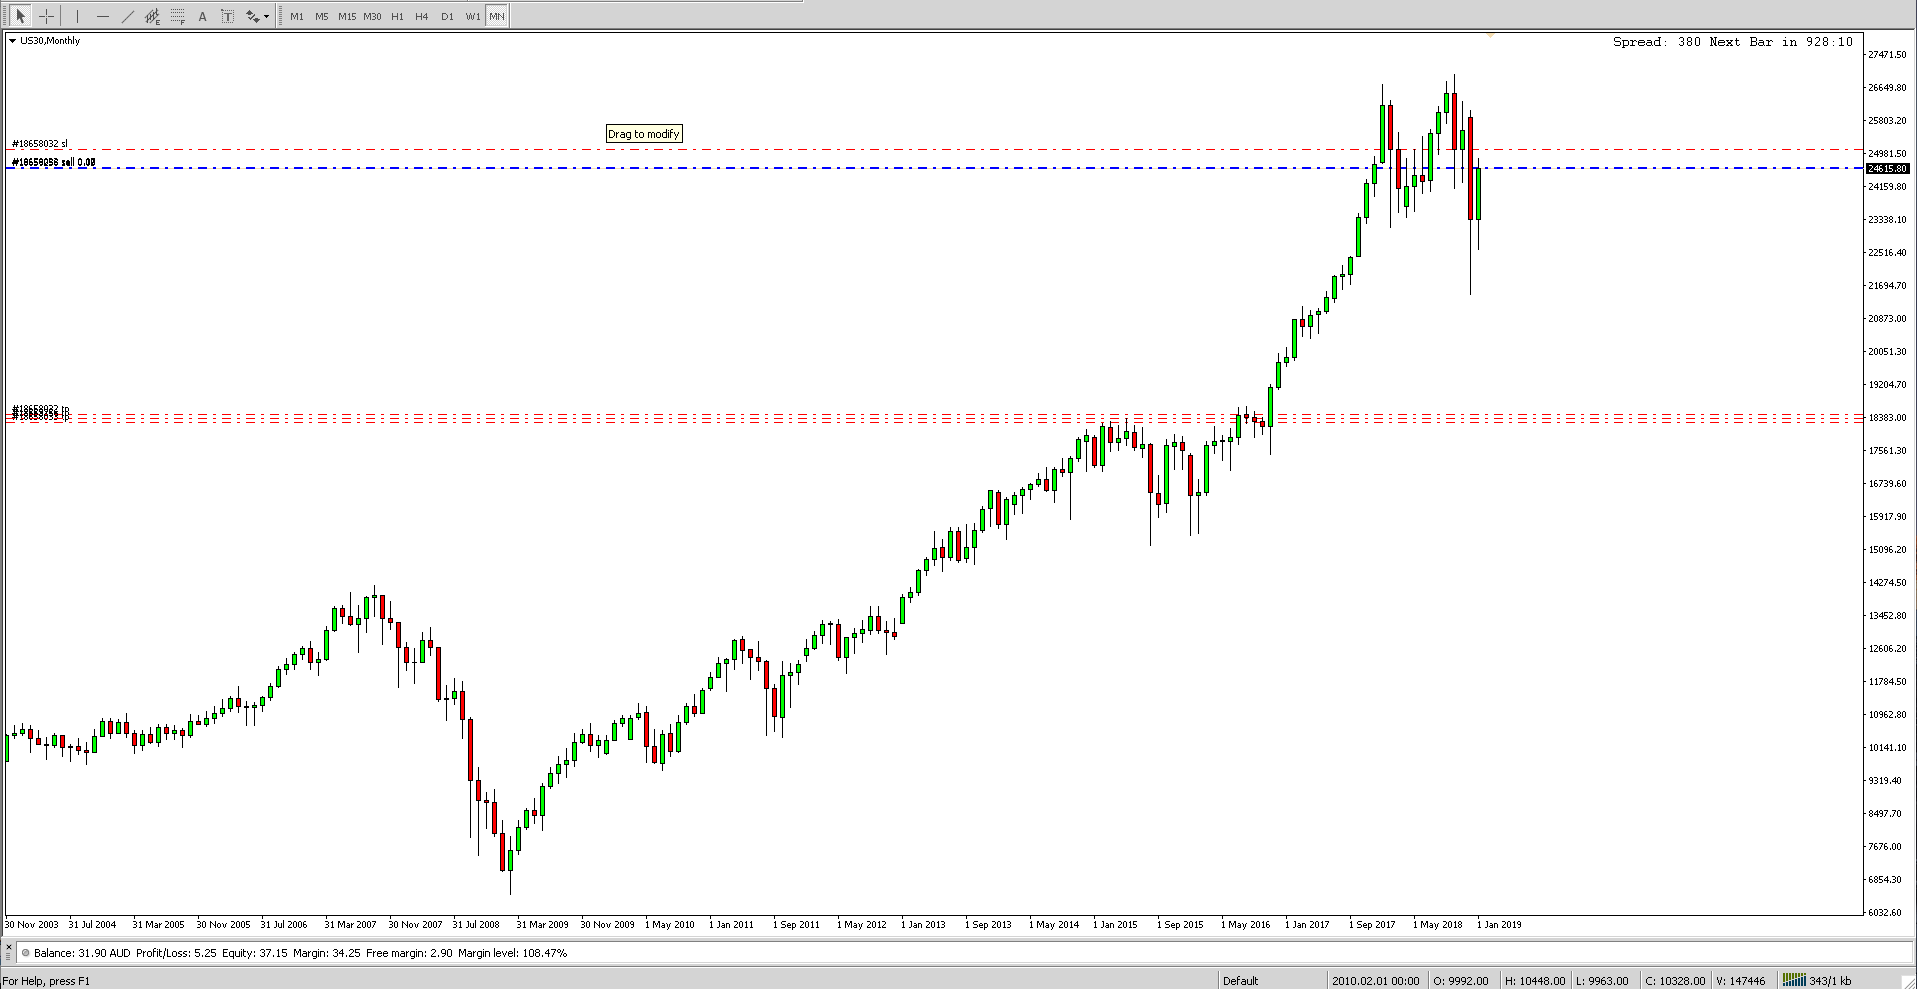
So as you can see, I have a few live trades on. You can also see there has been a huge run up since November 2016.
thats a long time without seeing a correction.
So this is going to be a long trade, due to the small account not sure how long I will hold this in. I don't want to be too greedy.
I am actually paying close attention to the second last red candle, which has essentially put a lower low in place. So now lets check out the weekly.
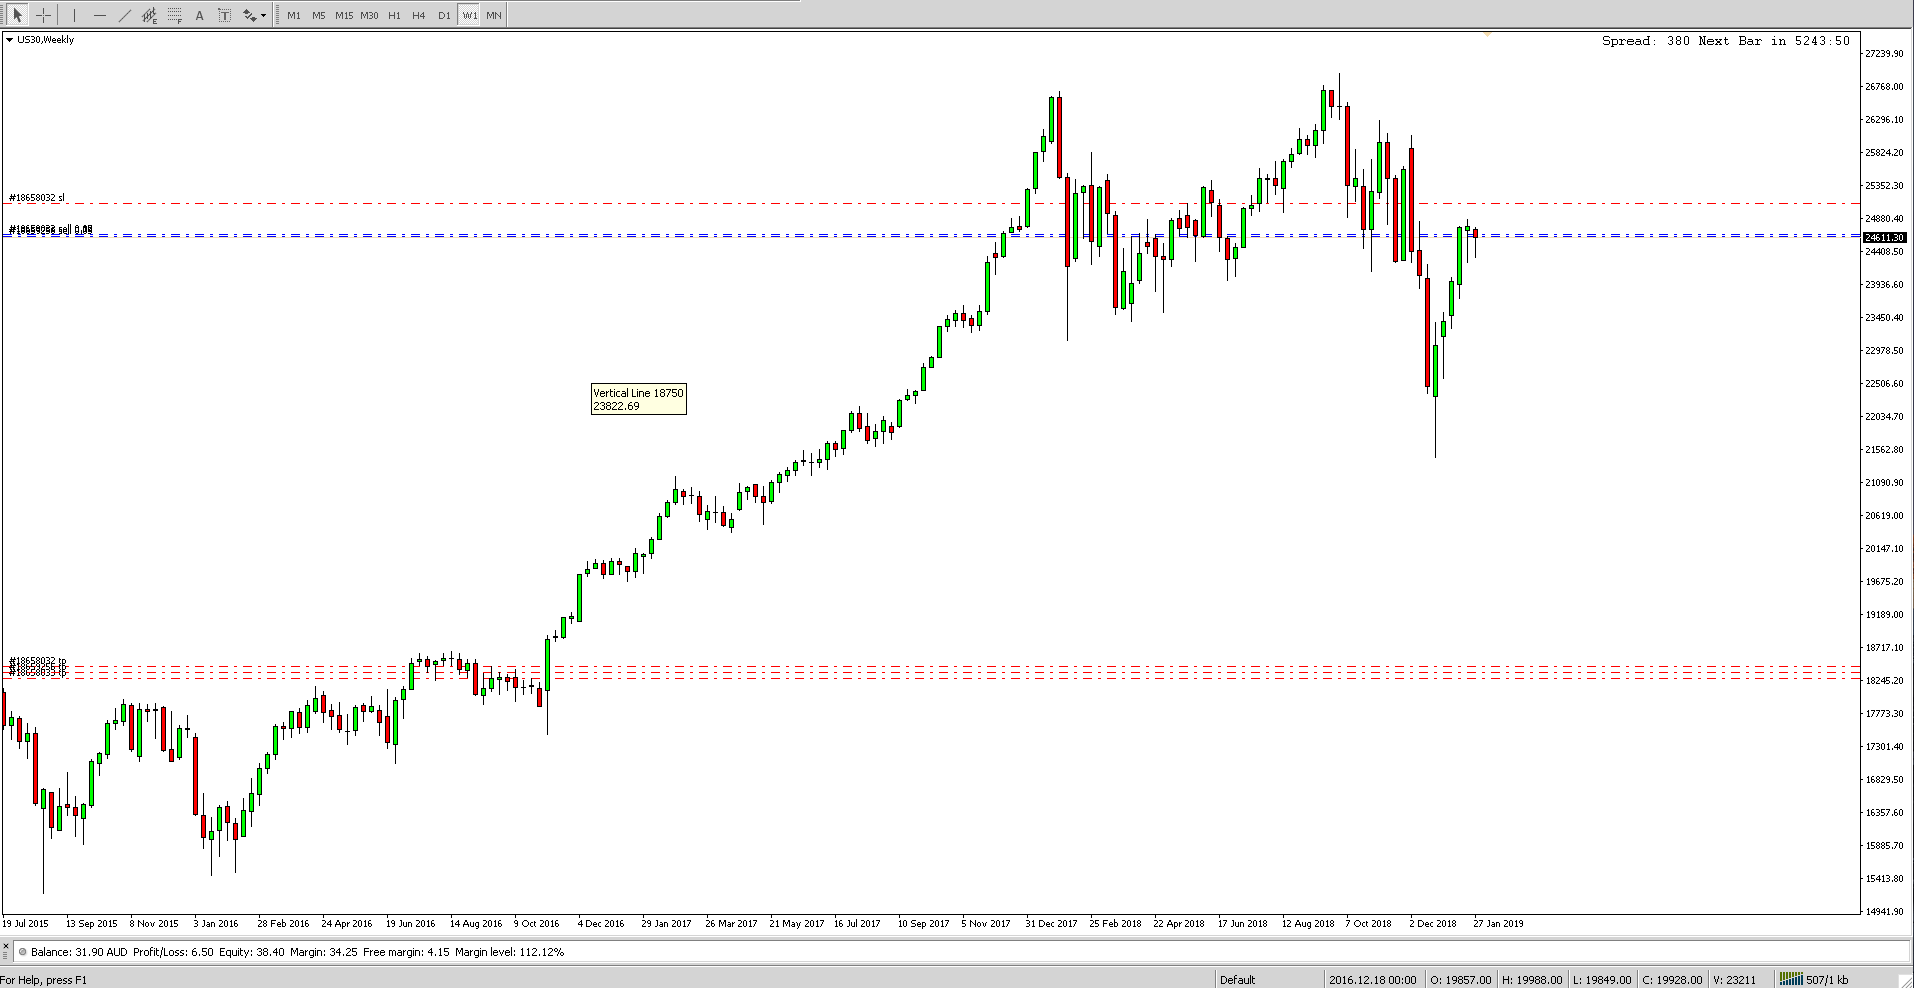
Price has now pulled back up to retest prior support turned resistance! I managed to check out the charts at the right time (what I think is the right time, I could be horribly wrong, only time will tell). But the prior weekly candle is showing signs of bullish exhaustion. Two confirmations already to enter a short trade. The First being a the monthly candle of December 2018 has set a lower low and this month correcting back into and testing resistance, the second confirmation being the weekly candle is in this area of pull back and is showing signs of weakness. Now lets check out the Daily.
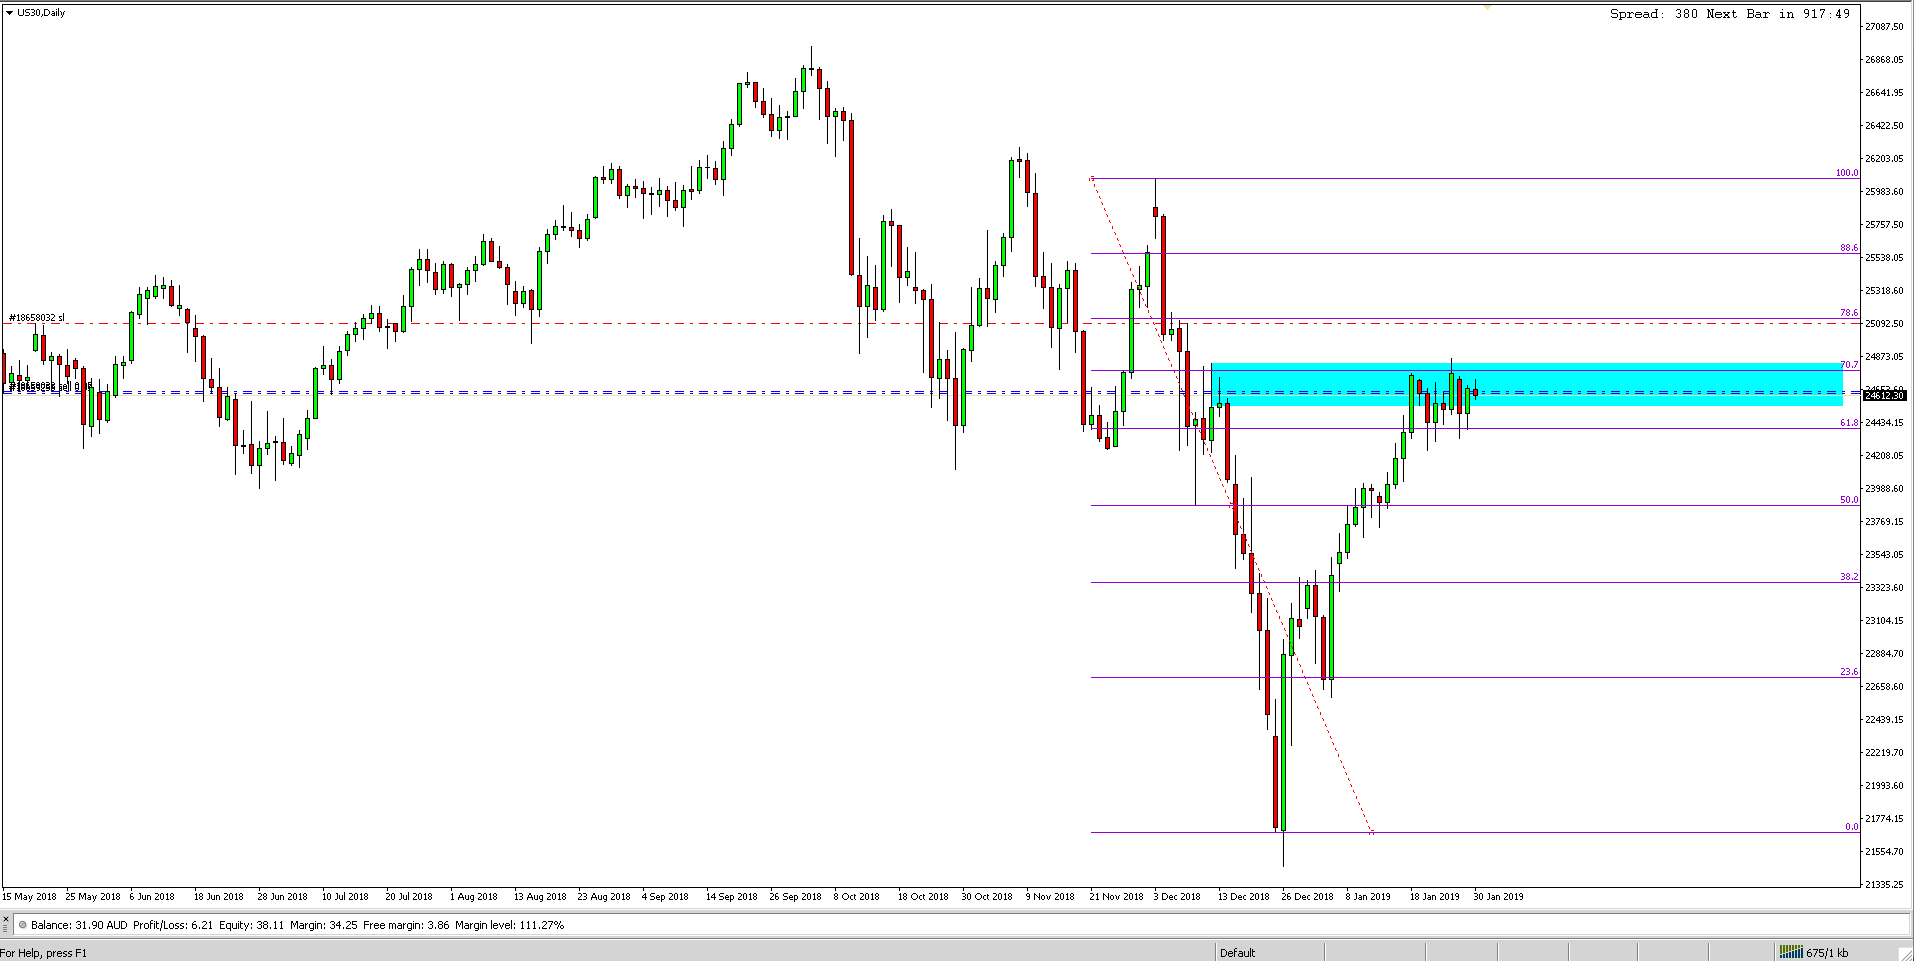
For this daily chart, I decided to draw a basic Fib from a prior high to a new low. and a liquidity zone. Here are two more confluences! one being the fact that price has already come up to meet a resistance level on the fib. Now lets look to the left and we can see prior price has struggled around this area as well.
The second confluence in this daily chart is price has now re-entered this zone of prior price resistance, acting as an area to place trade. A double top entry which is a great higher percentage pattern, that traders like to trade from. Not only this but has not broken the blue liquidity zone for 9 days!
Now you could argue that in this chart on the daily with in those 9 recent days, it has a higher low. Well yes it looks like this, but when you go into a higher time frame such as the weekly, there is a lower low and to me a higher time frame trumps a smaller time frame. Making the daily's lower low irrelevant and trades might need a closer monitor whilst price is still in this liquidity region because price could push higher. At the moment I don't believe it will due to my above analysis.
My last Time frame I will put up is in fact the 4hr
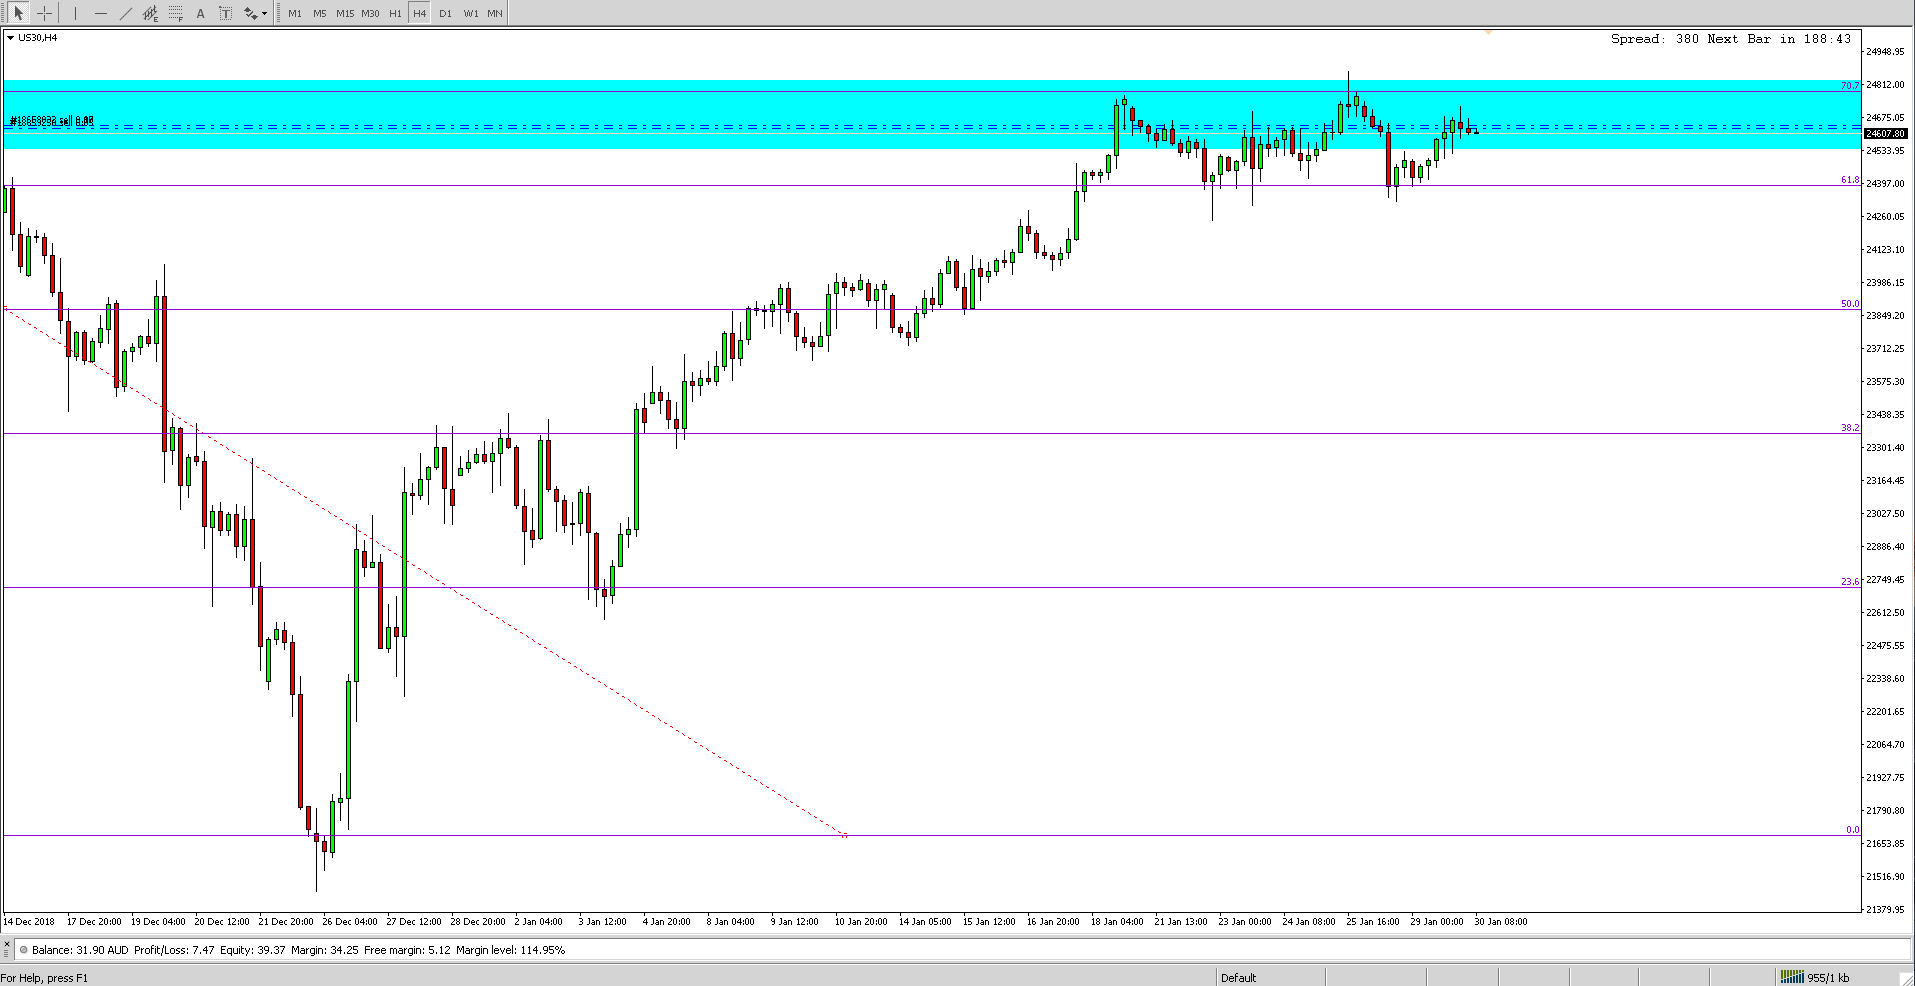
You can see once again in this time frame a lower low, it's hard to see with an untrained eye, but its pushed back higher to create a lower high, which is great for an entry position for a sell.
So this is my analysis and if you go to the monthly chart i posted first you will see where I have entered price already!
you will then see another red dotted line lower. This an area price has to come back to to retest a prior resistance as support, it might take days or months to get there.
I am not sure how long these trades will be held for, due to it not being a big account which means holding it for a long period of time will result in SWAP fee's and Commission Fee's that might take a lot of money away from my total profits.
Another likely scenario is price spikes up higher and takes my trades out and the account is in a loss. This is a VERY VERY high risk trade using a VERY VERY small account of $30 AUD. But if it goes the way i predicted then I would be in roughly around $1,500 profit from $30.
I will update you all on how the trade goes, but I am not the best trader and this is not trading advice, it is just my own thoughts on the US30 Charts and where I think it could be heading... all information I have written is for my own learning and should not be taken as trading advice ever and not responsible for anyone else's actions.
Stay Safe, Happy Trading x
Update: trade went against my position. Re group and look for newer entries! Always adapt to what is happening. Love forex! every trade is a new lesson and you begin to learn the characteristics of certain pairs, looking back i should of put a tight stop loss in profit when it was $12, but I wanted to swing the trade which you can't really do with super super small accounts... hmm note to self: Only enter and monitor small accounts on lower Time Frames but analyse on a higher time frame
Congratulations @welcometolife! You have completed the following achievement on the Steem blockchain and have been rewarded with new badge(s) :
Click here to view your Board
If you no longer want to receive notifications, reply to this comment with the word
STOPTo support your work, I also upvoted your post!