Thanks for this update with pic in pic feature.
Is there a specific reason why you switched back to linear scaling on the weekly and daily chart? Looking at corrections in the past (e.g. ETH's wave 2 in 2016) they appear too flat(~23.6%) in log but perfectly match with the fibs in linear (~61.8%) but projections fit better with log scale. So one could have easily missed the train or the rocket while staring at log charts and waiting for a correction that never came. It's sometimes confusing in volatile cryptos which scaling to use.
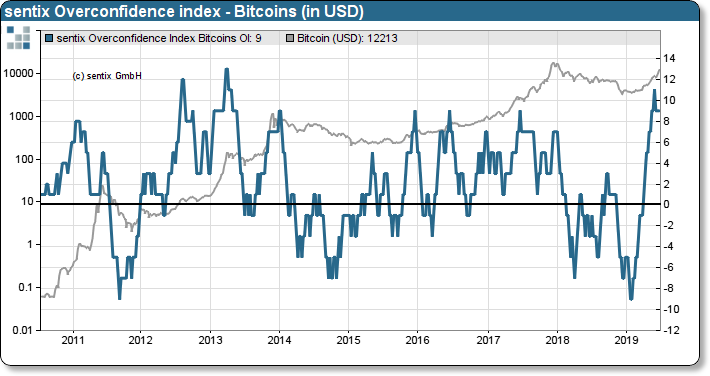
P.S.: I recently came across a long term sentiment analysis and thought it might be interesting to you. This index reflects the risk that investors might take to risky positions based on the behavior of the bitcoin price.
It's not linear. I don't believe in switching a back and forth. It is important, in my view to use the same extensions as litmust tests on all timeframes. I'm not sure what gave you the idea it was linear.
OK. I noticed that price increment is constant and the log button at the bottom right seemed to be not activated but it doesn't matter for now.
You scared me and I double checked LOL
For sentiment, I use optix on Sentiment trader.com. It is very useful statistically over the follow 30 days when at extremes and we hit extreme levels recently.