Presenting..... A Rainwater Harvesting Simulator: Your Crystal Ball for Water Security
%20-%202025-10-31%20at%2010.53.54.png)
Hey Everyone! Long Time :)
I'm sharing this free tool — something that I made — that helps you simulate and understand Rainwater Harvesting in your location and climate.
This is no ordinary calculator...
SO... IF you happen to be looking to set up a rainwater harvesting system, this is well worth a look!
Might save you a lot of problems down the line!
Most rainwater calculators give you a single number based on average rainfall and call it a day.
But here's the problem:
You don't live in an "average" year.
Some years it pours. Some years there's drought.
Your water system needs to handle all of them.
That's where this simulator comes in.
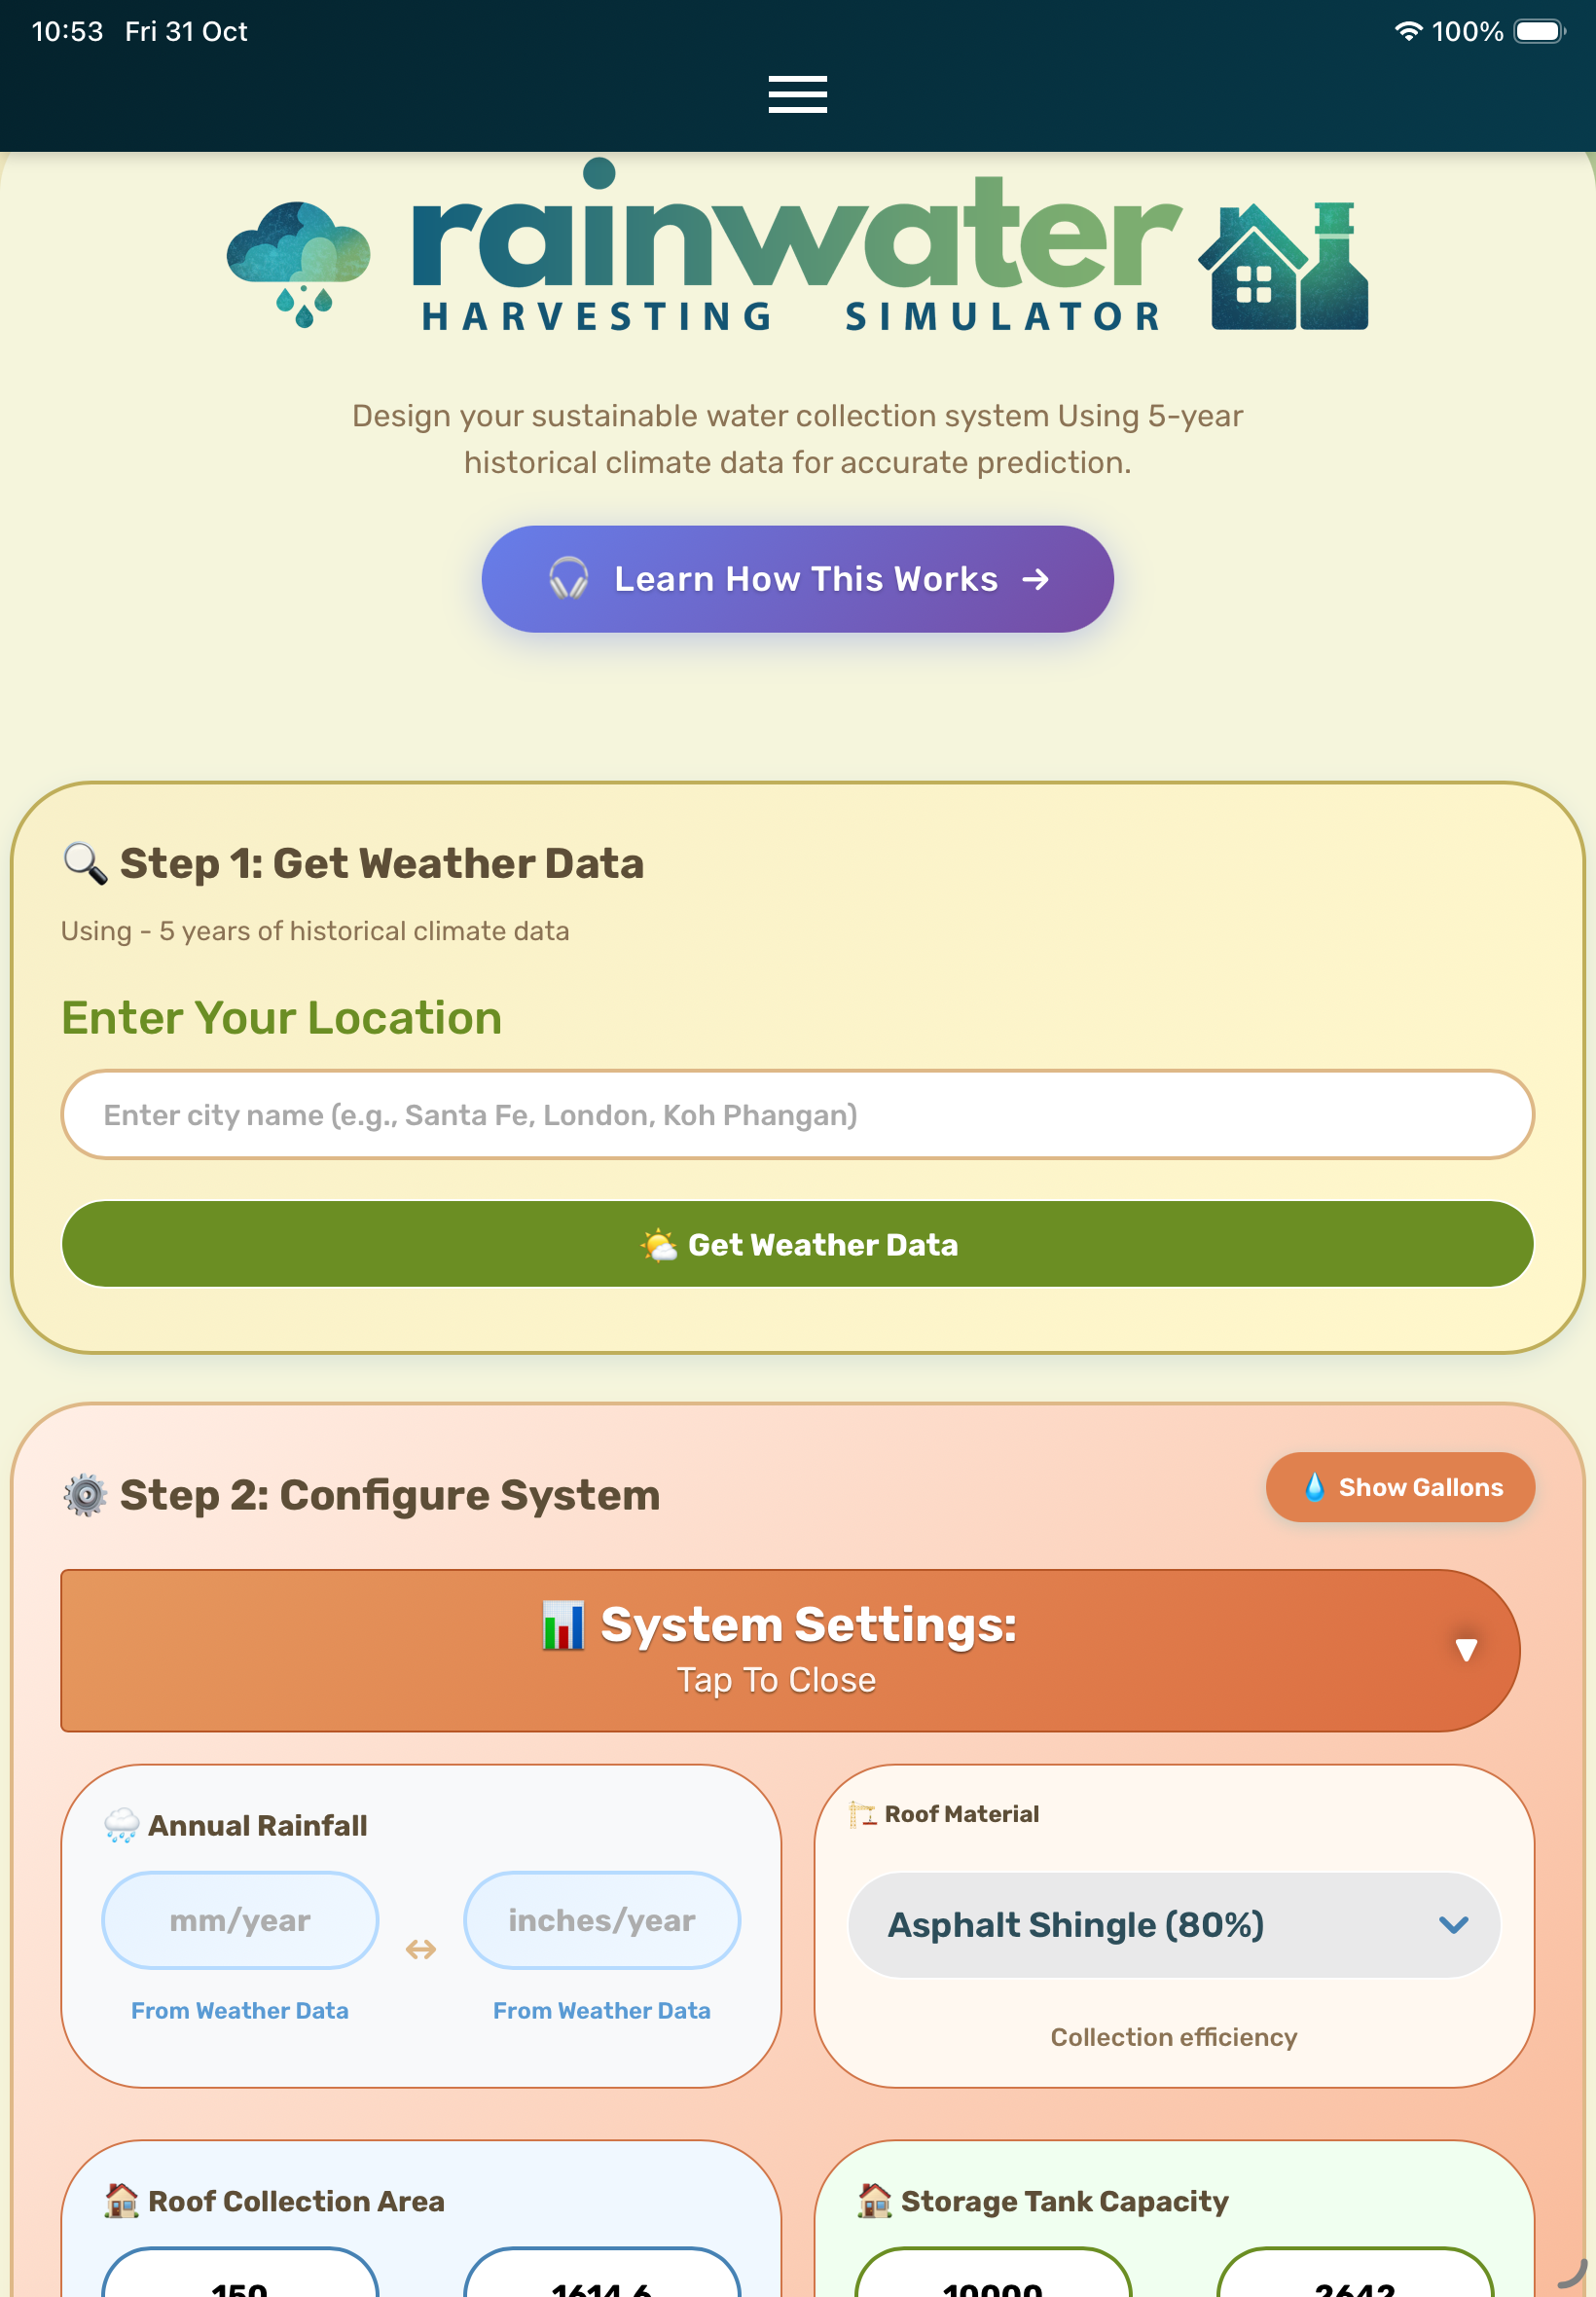
🌧️ Real Weather Data, Real Answers
This tool pulls 5 years of actual historical rainfall data for your location — not estimates, not averages, but the real day-by-day rainfall from 2020–2024 (or your location’s available data).
Then it runs a complete simulation of your proposed system through each of those years, tracking:
- Every liter collected
- Every liter used
- Every day your tank runs dry
Here's What You'll Discover:
📊 The Big Picture
See how your system performs across multiple years.
Maybe 4 out of 5 years work perfectly — but year 3 was a disaster.
Now you know exactly what conditions cause problems — and how to fix them before you build.
🛡️ Worst-Case Planning
The tool automatically identifies your worst-performing year and uses that for design recommendations.
Why? Because if your system works in the worst year, it'll work in most years.
That's conservative, reliable design.
🌦️ Climate Variability Exposed
Watch rainfall swing from 1,200mm in a dry year to 1,800mm in a wet year.
See how this affects your water security.
Understand why "average annual rainfall" doesn't tell the whole story.
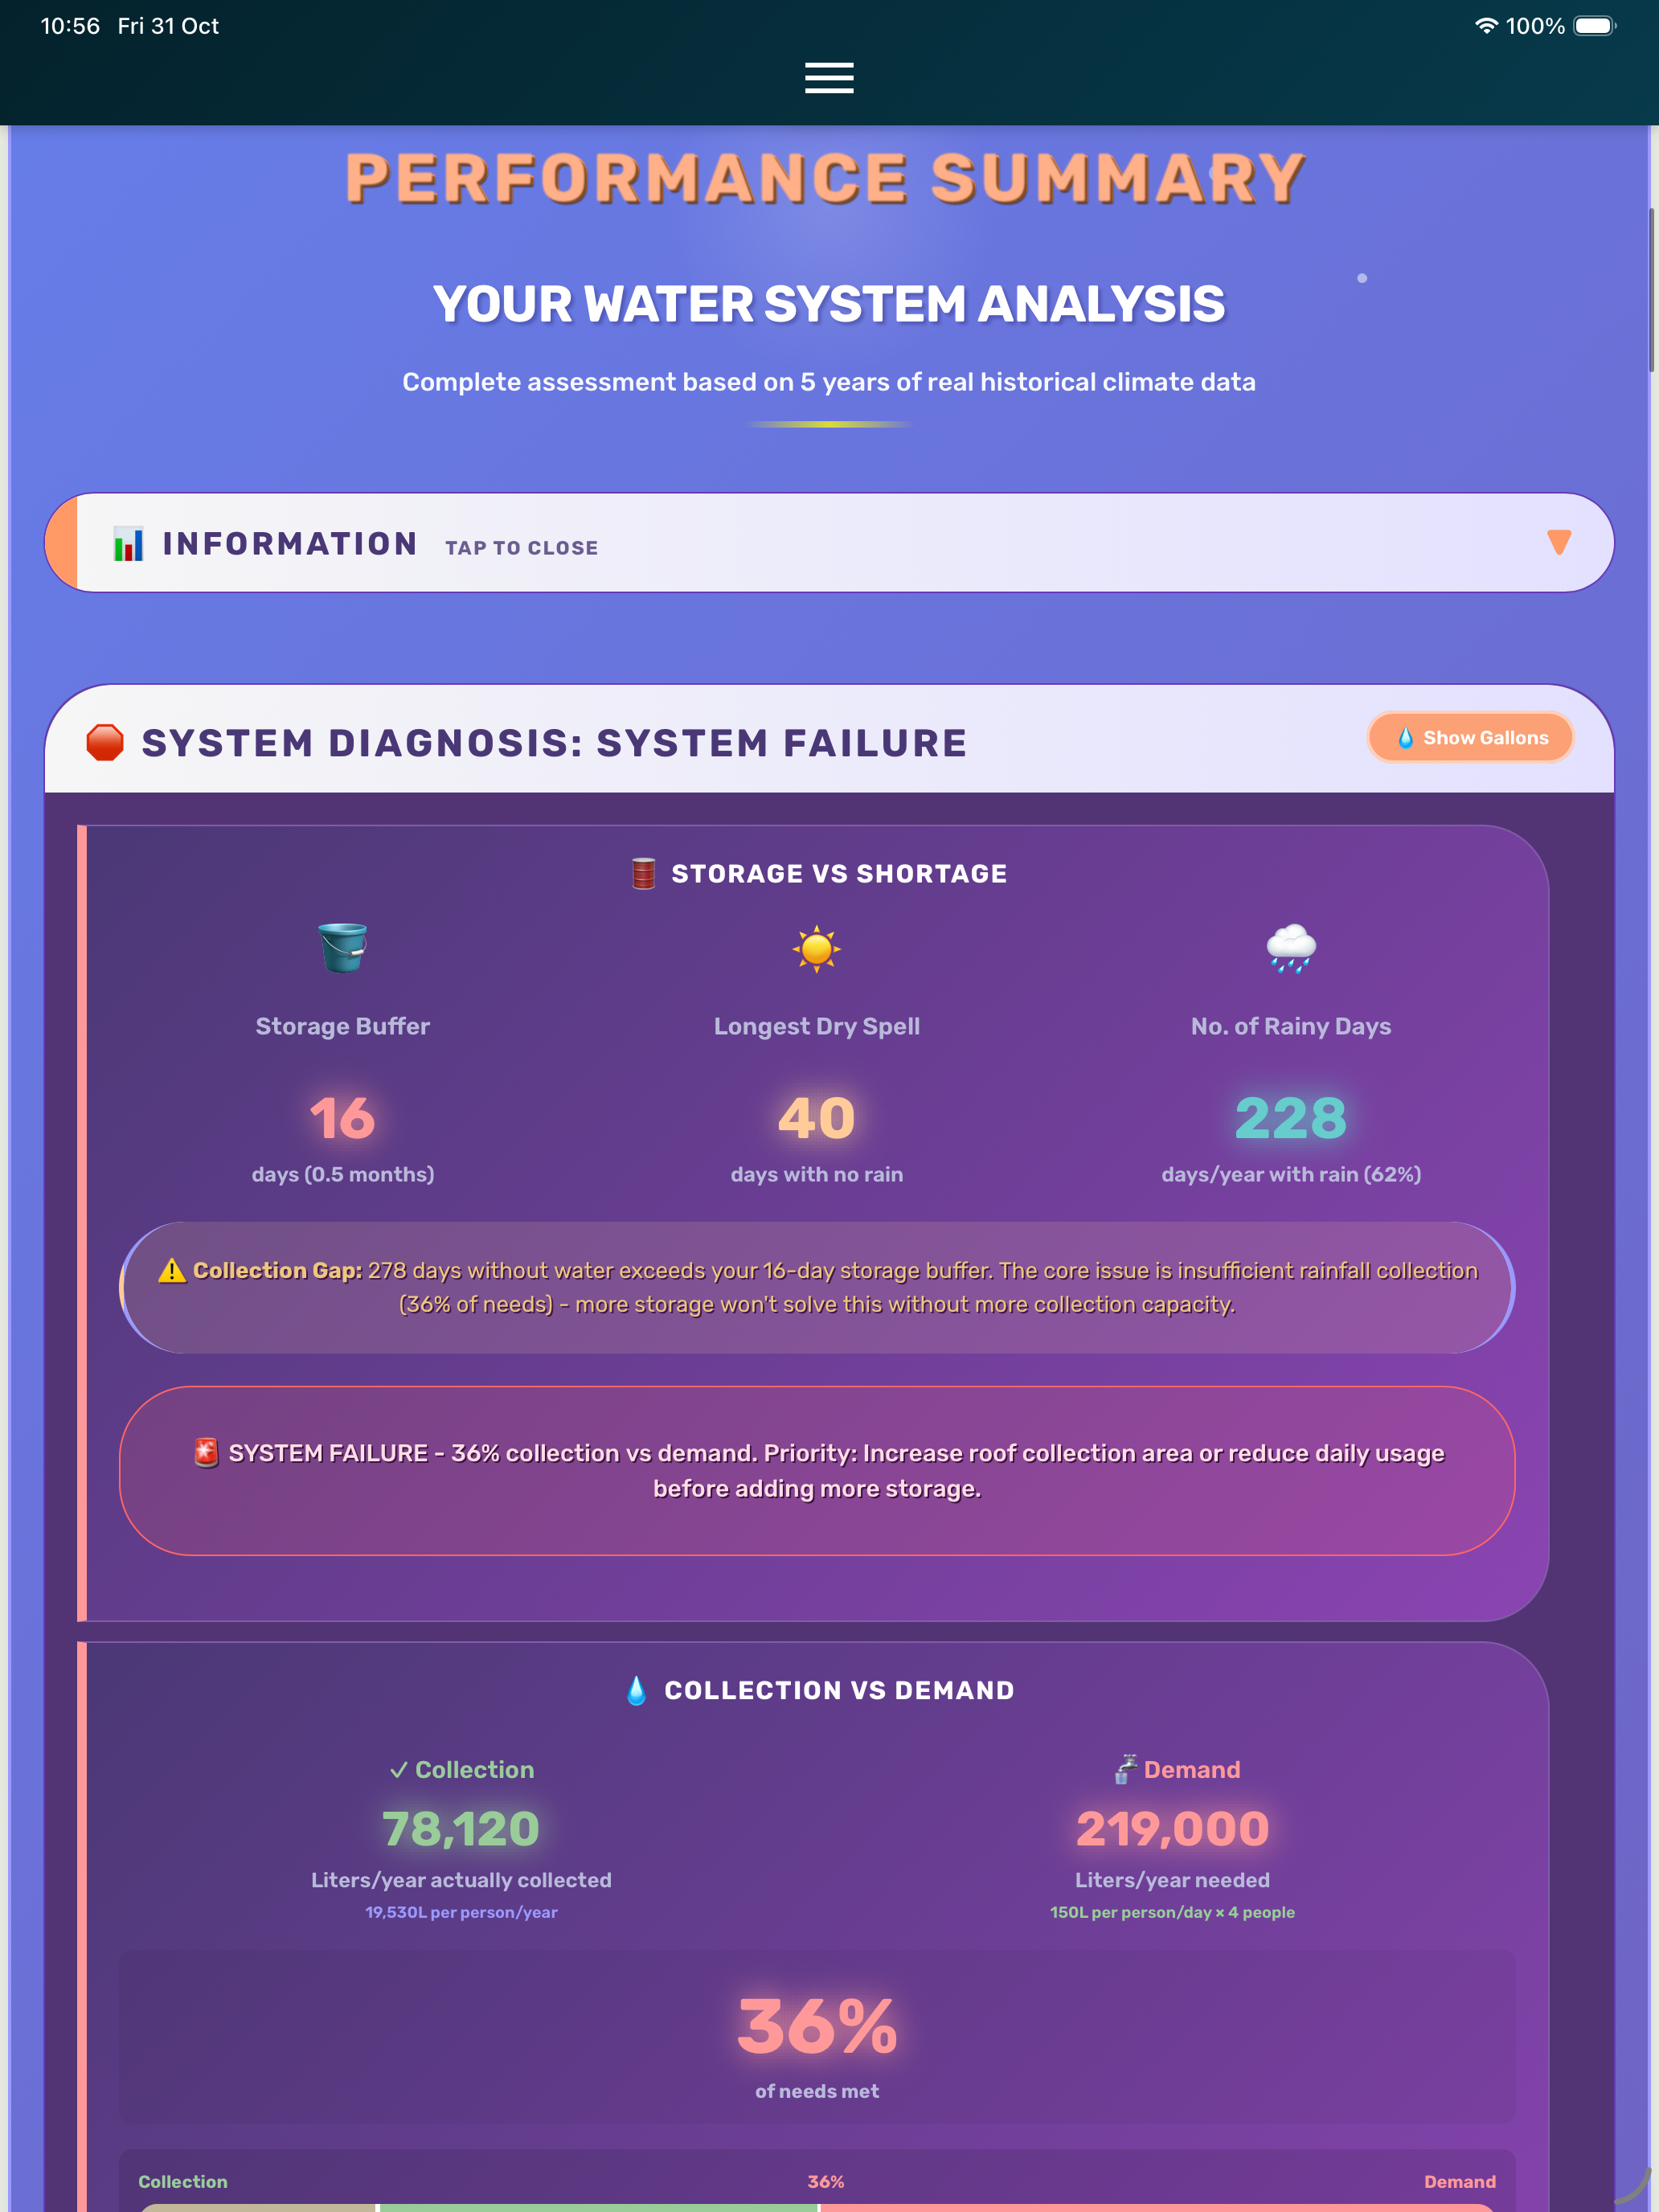
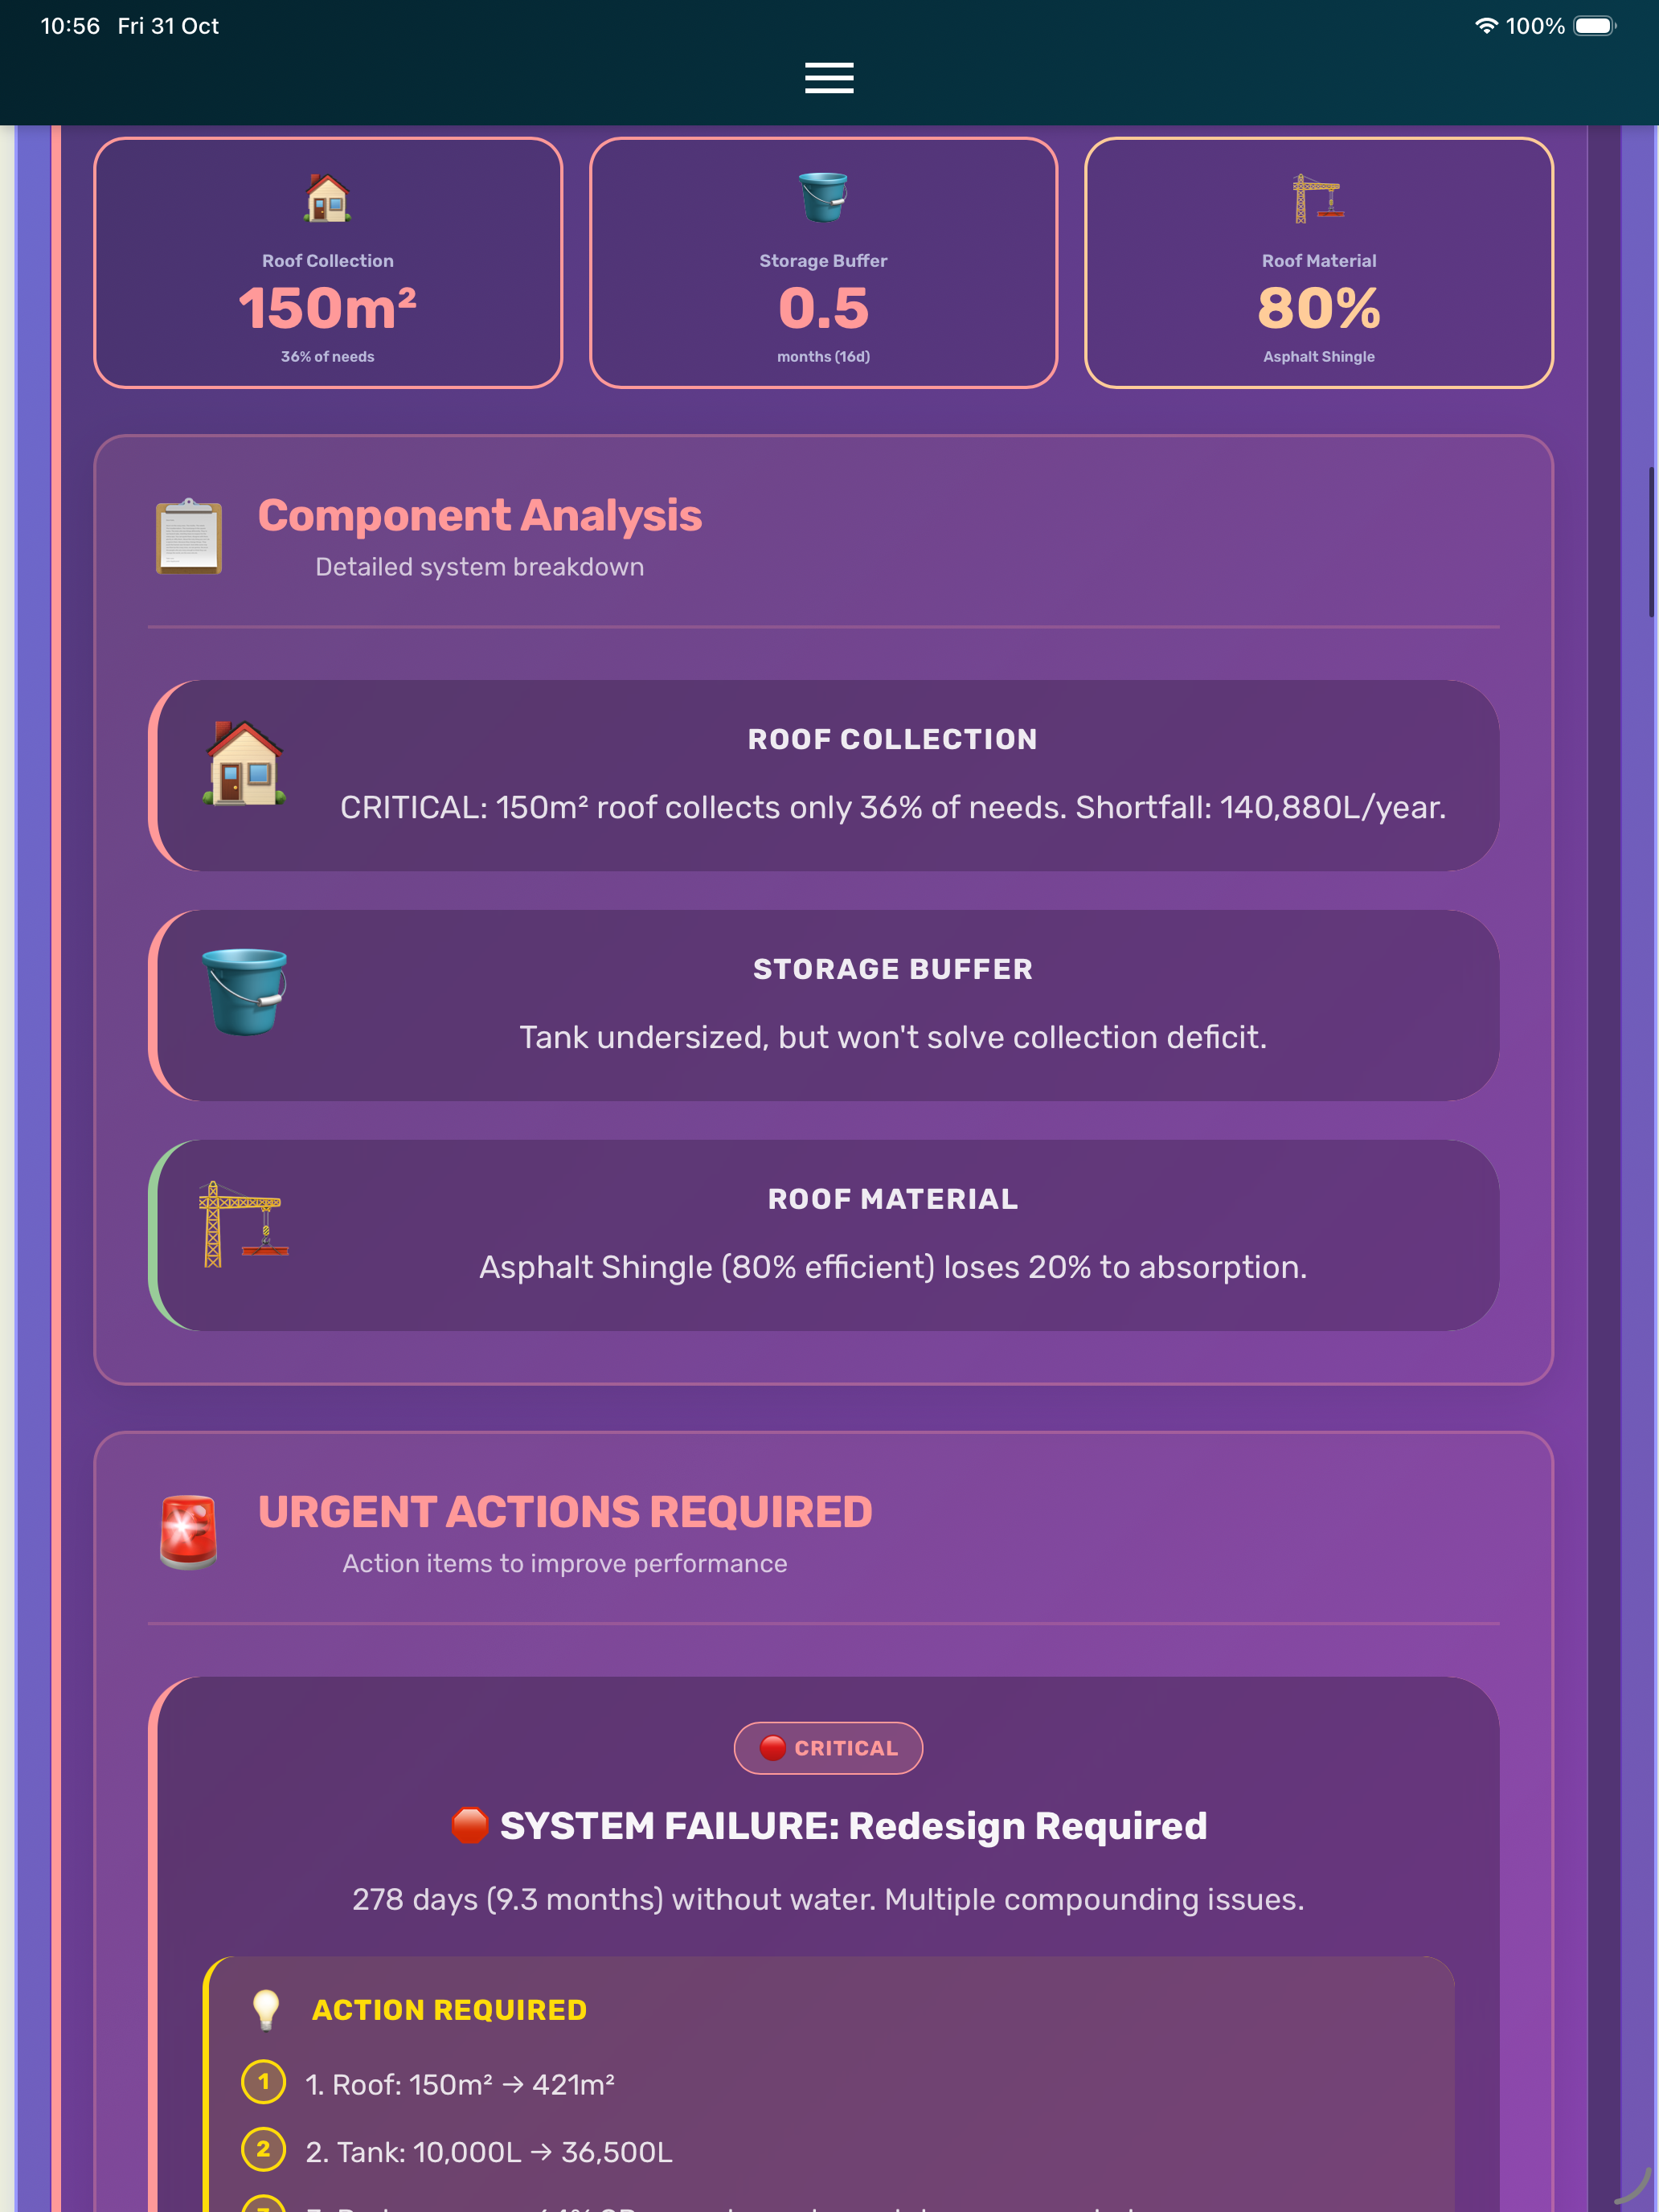
⚠️ When Things Go Wrong
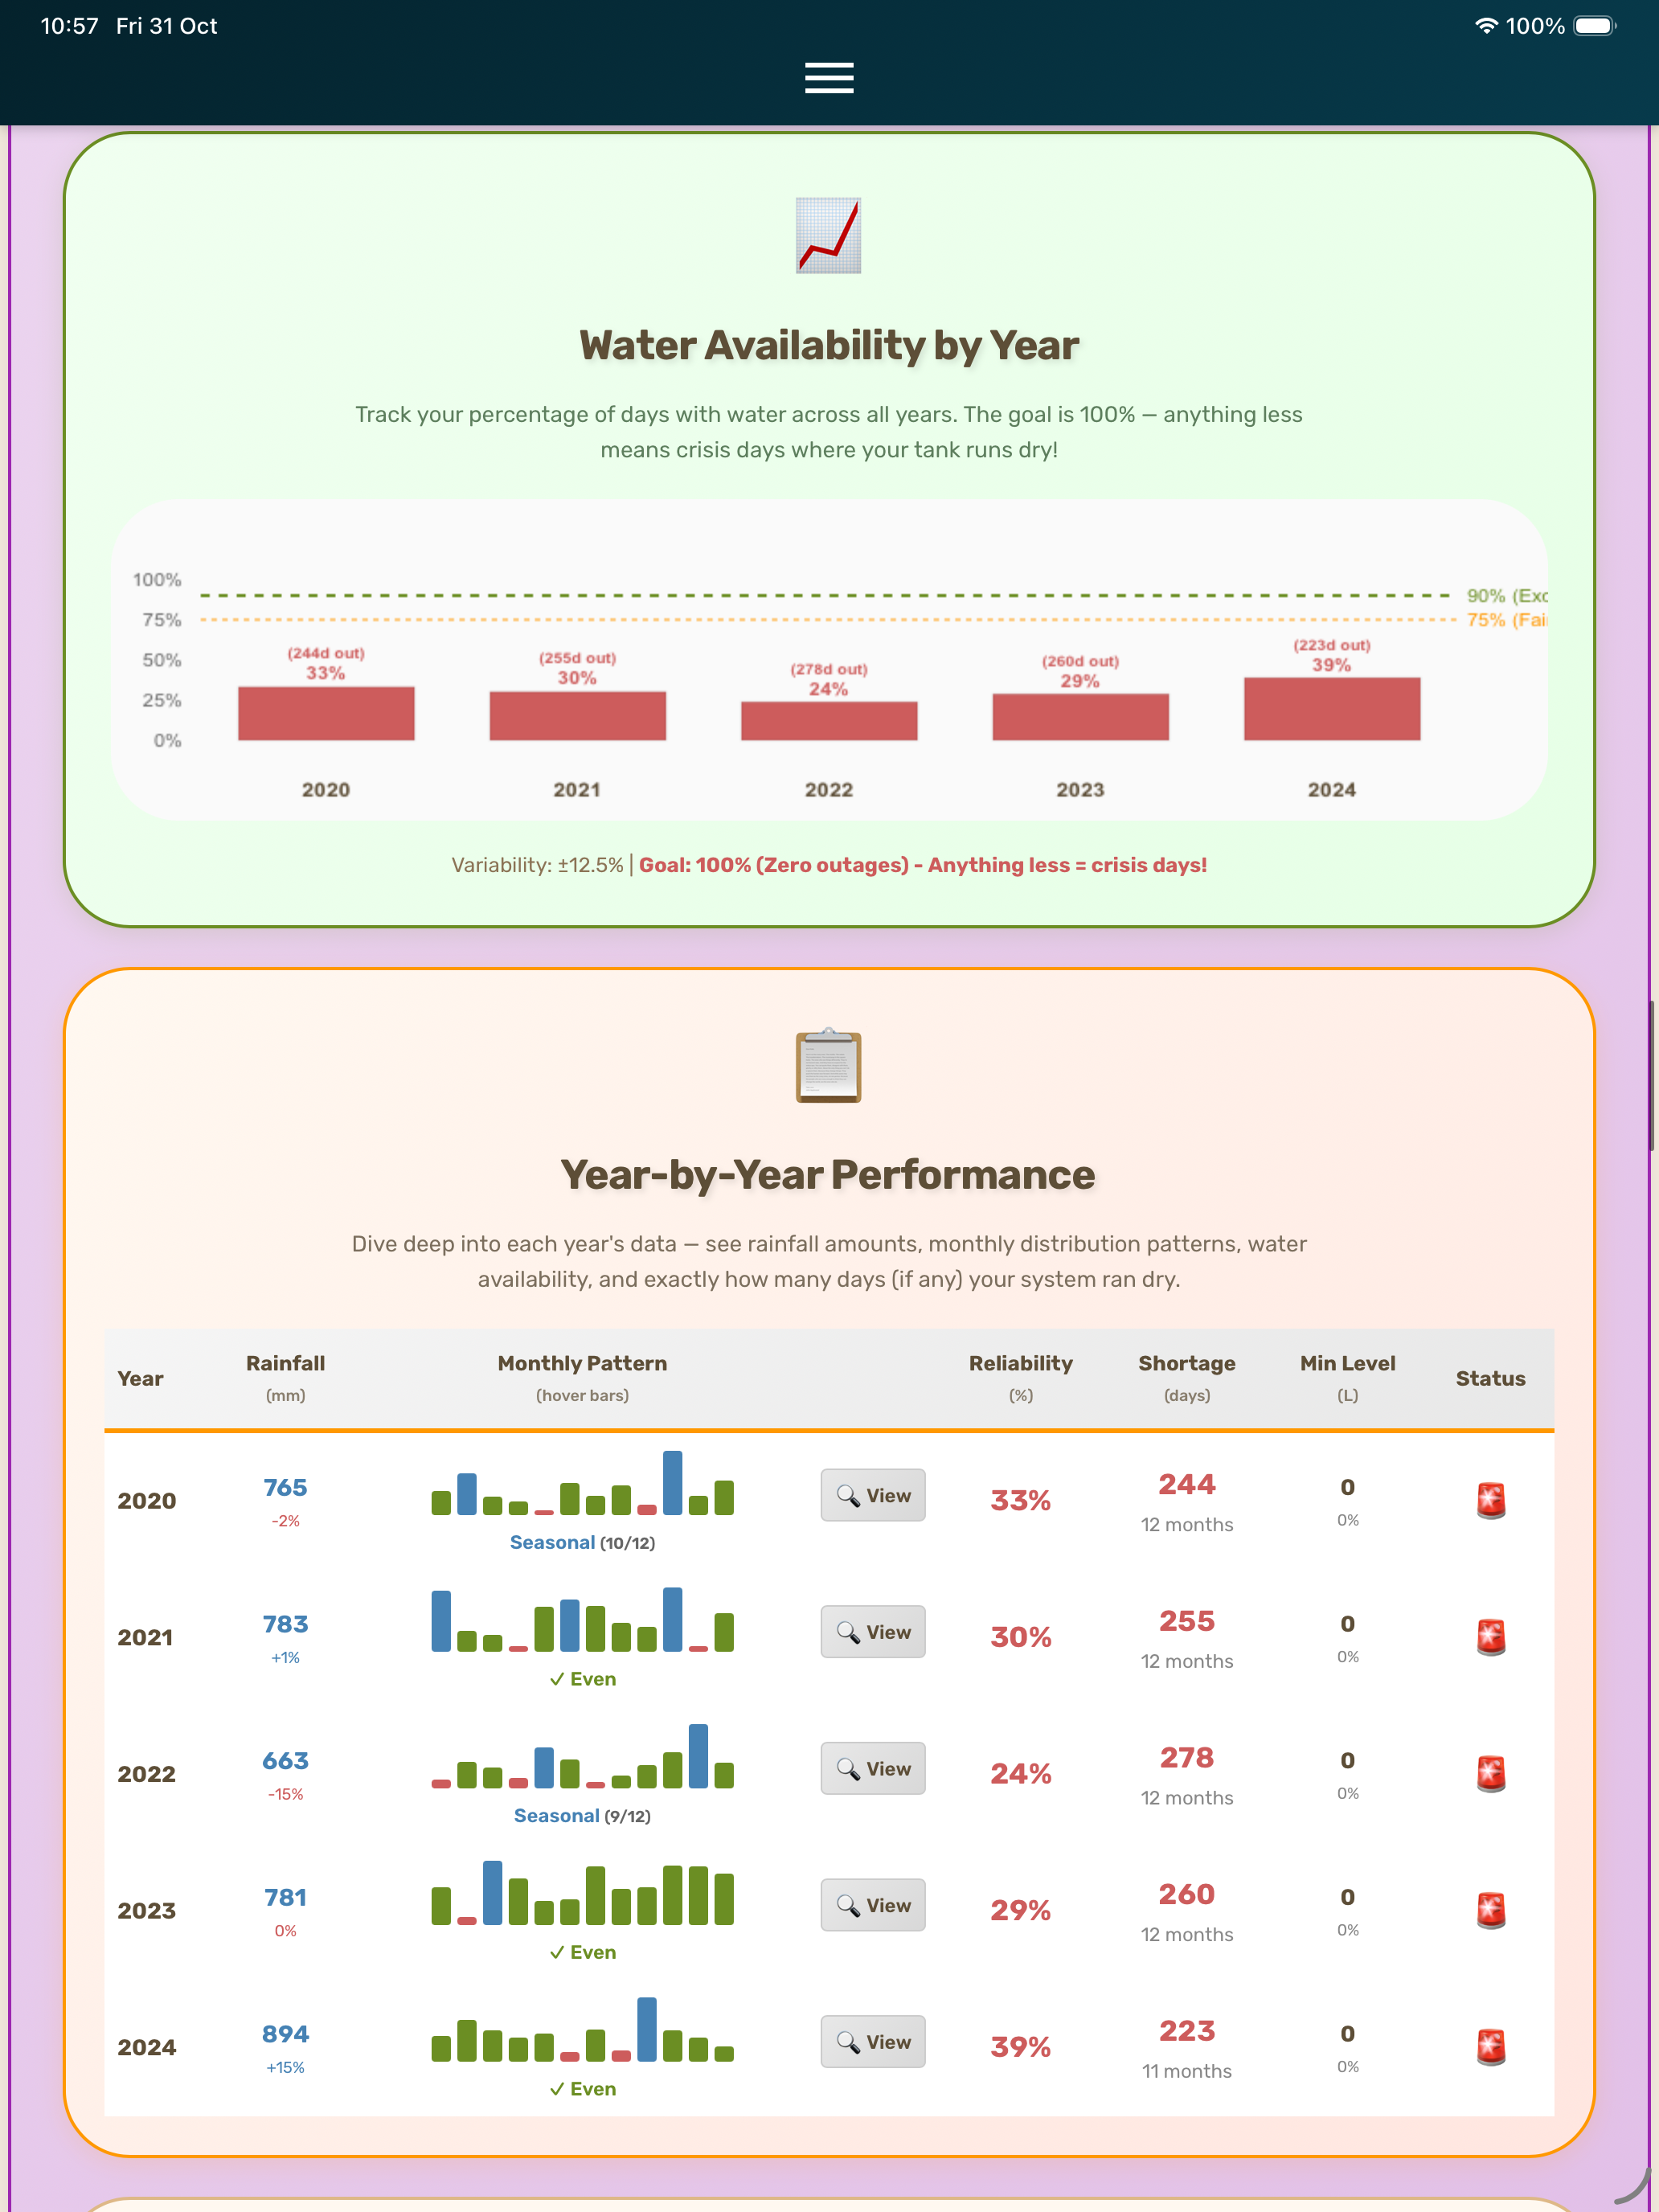
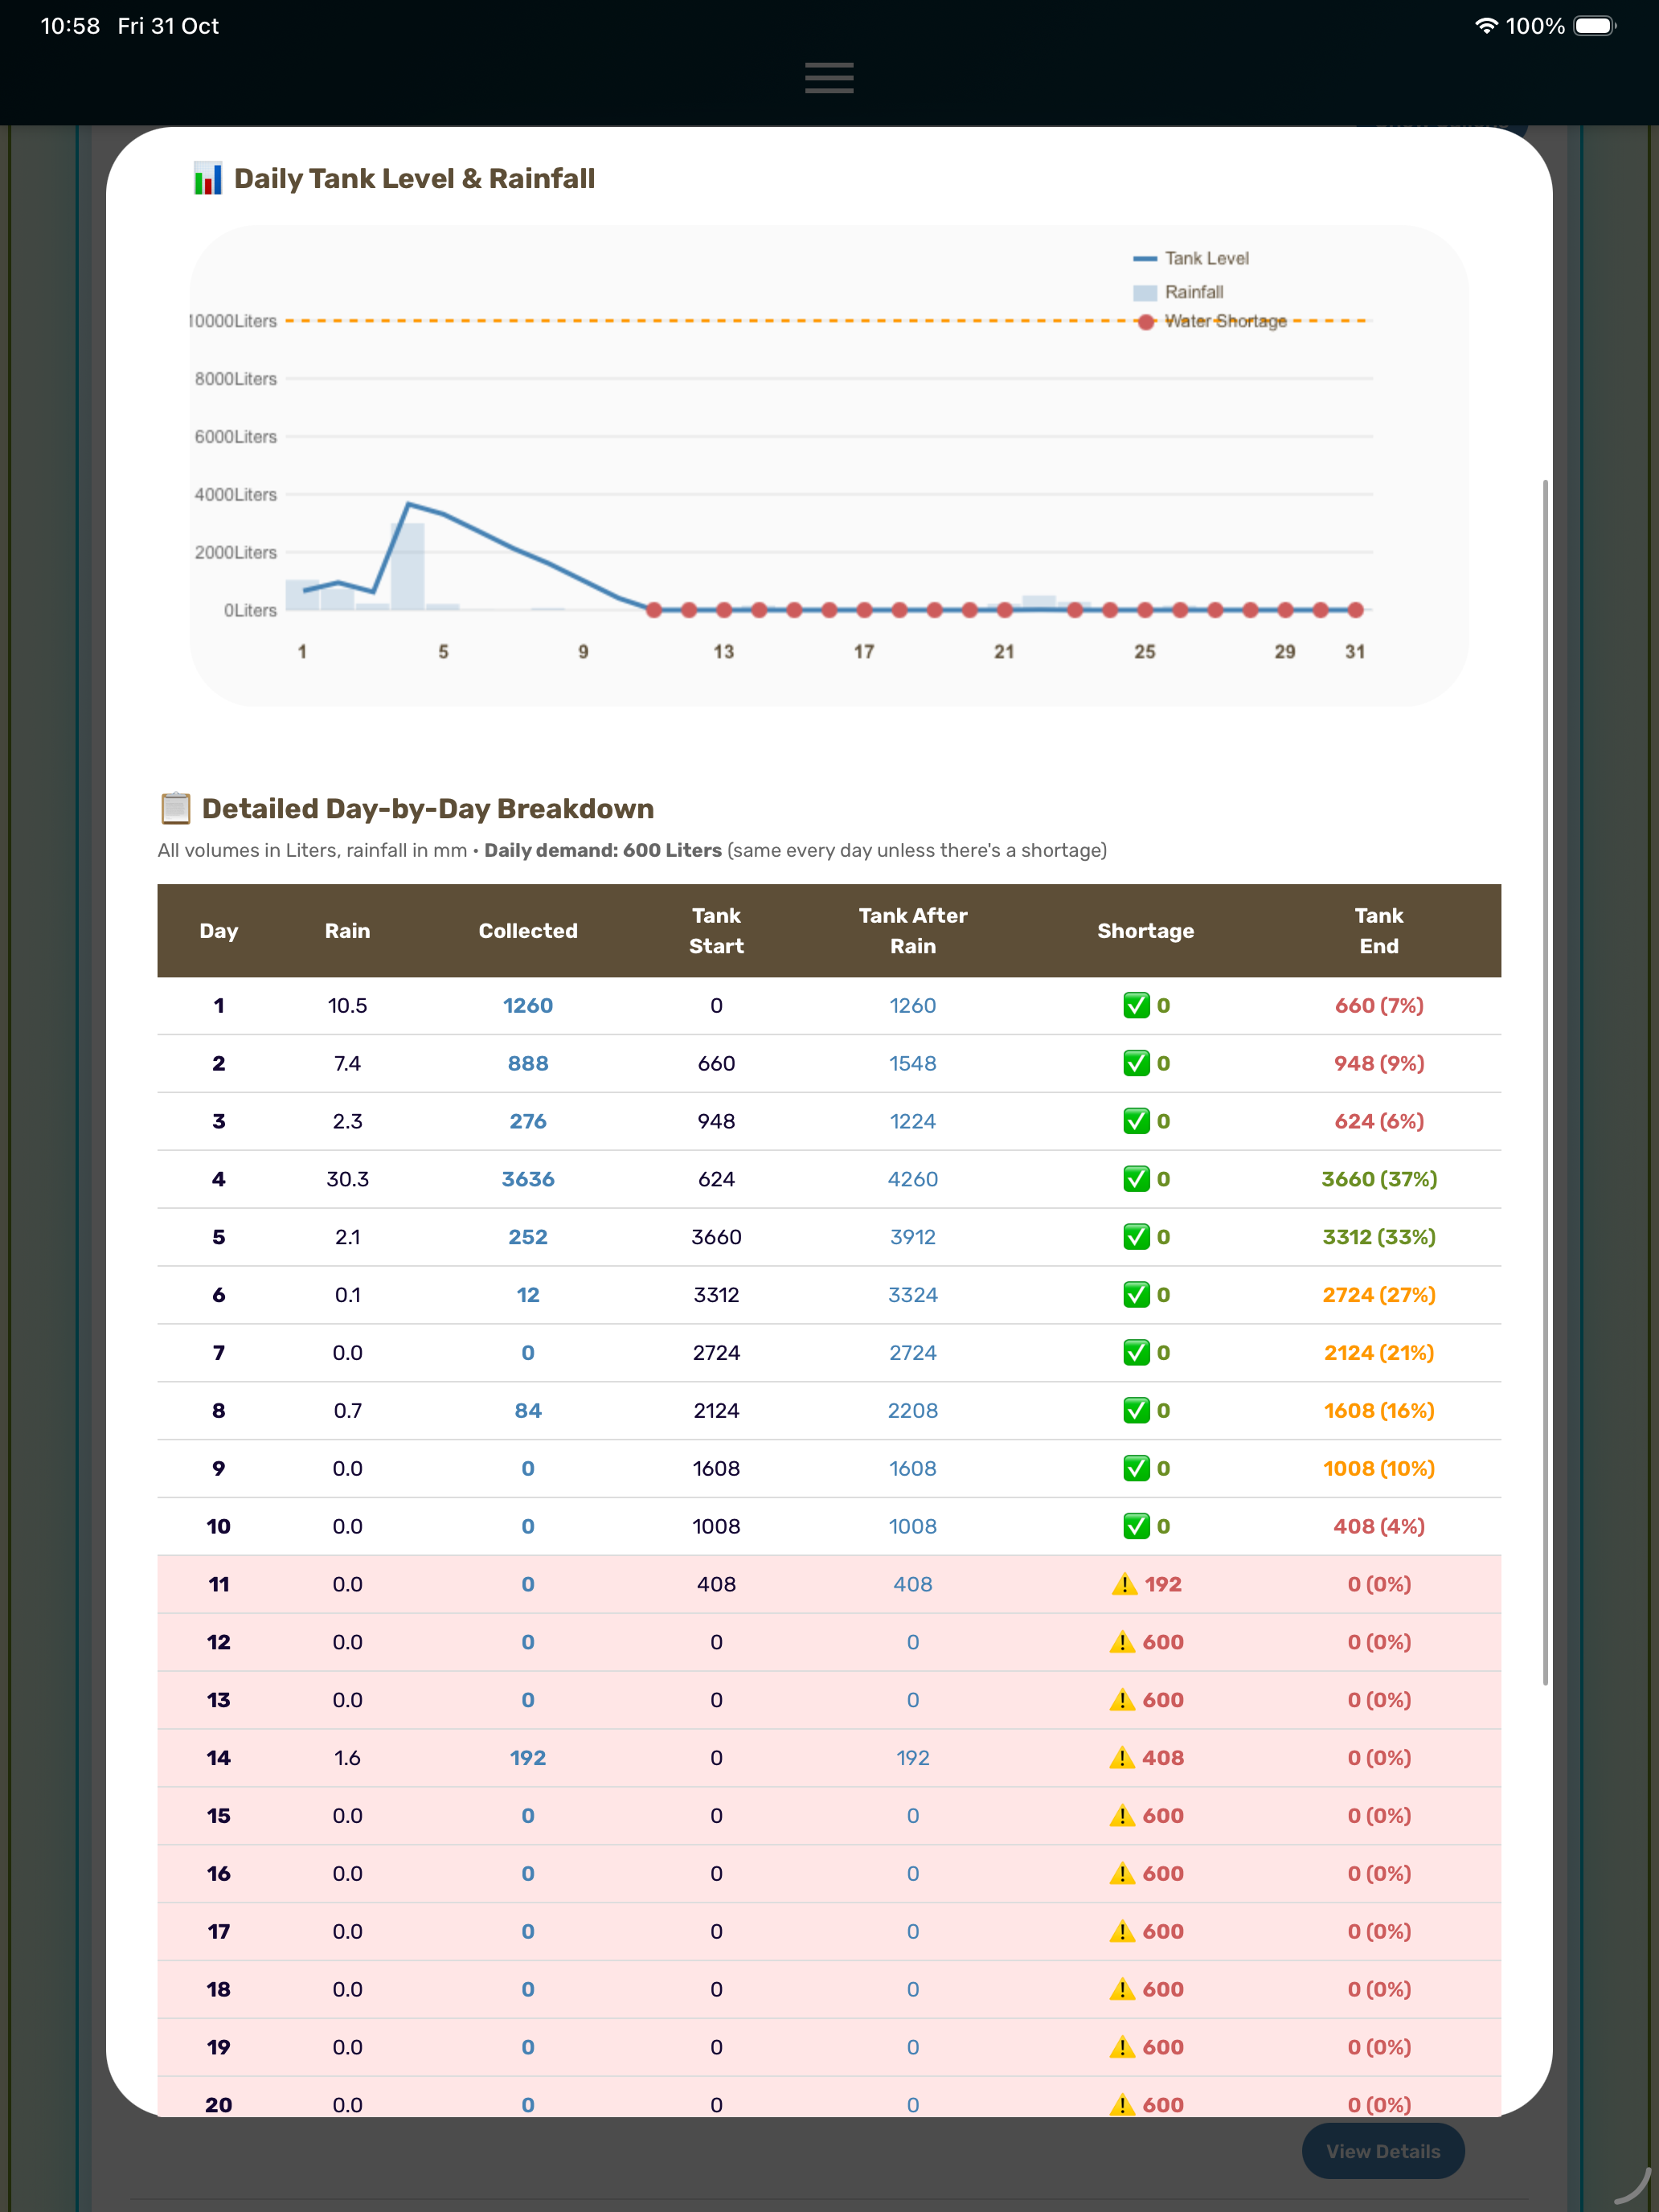
The year-by-year performance table shows you:
- Which months had water shortages
- How many days you went without water
- Why (low rainfall? tank too small? both?)
This isn't abstract — it's "You'll run out of water for 8 days in February" level of specific.
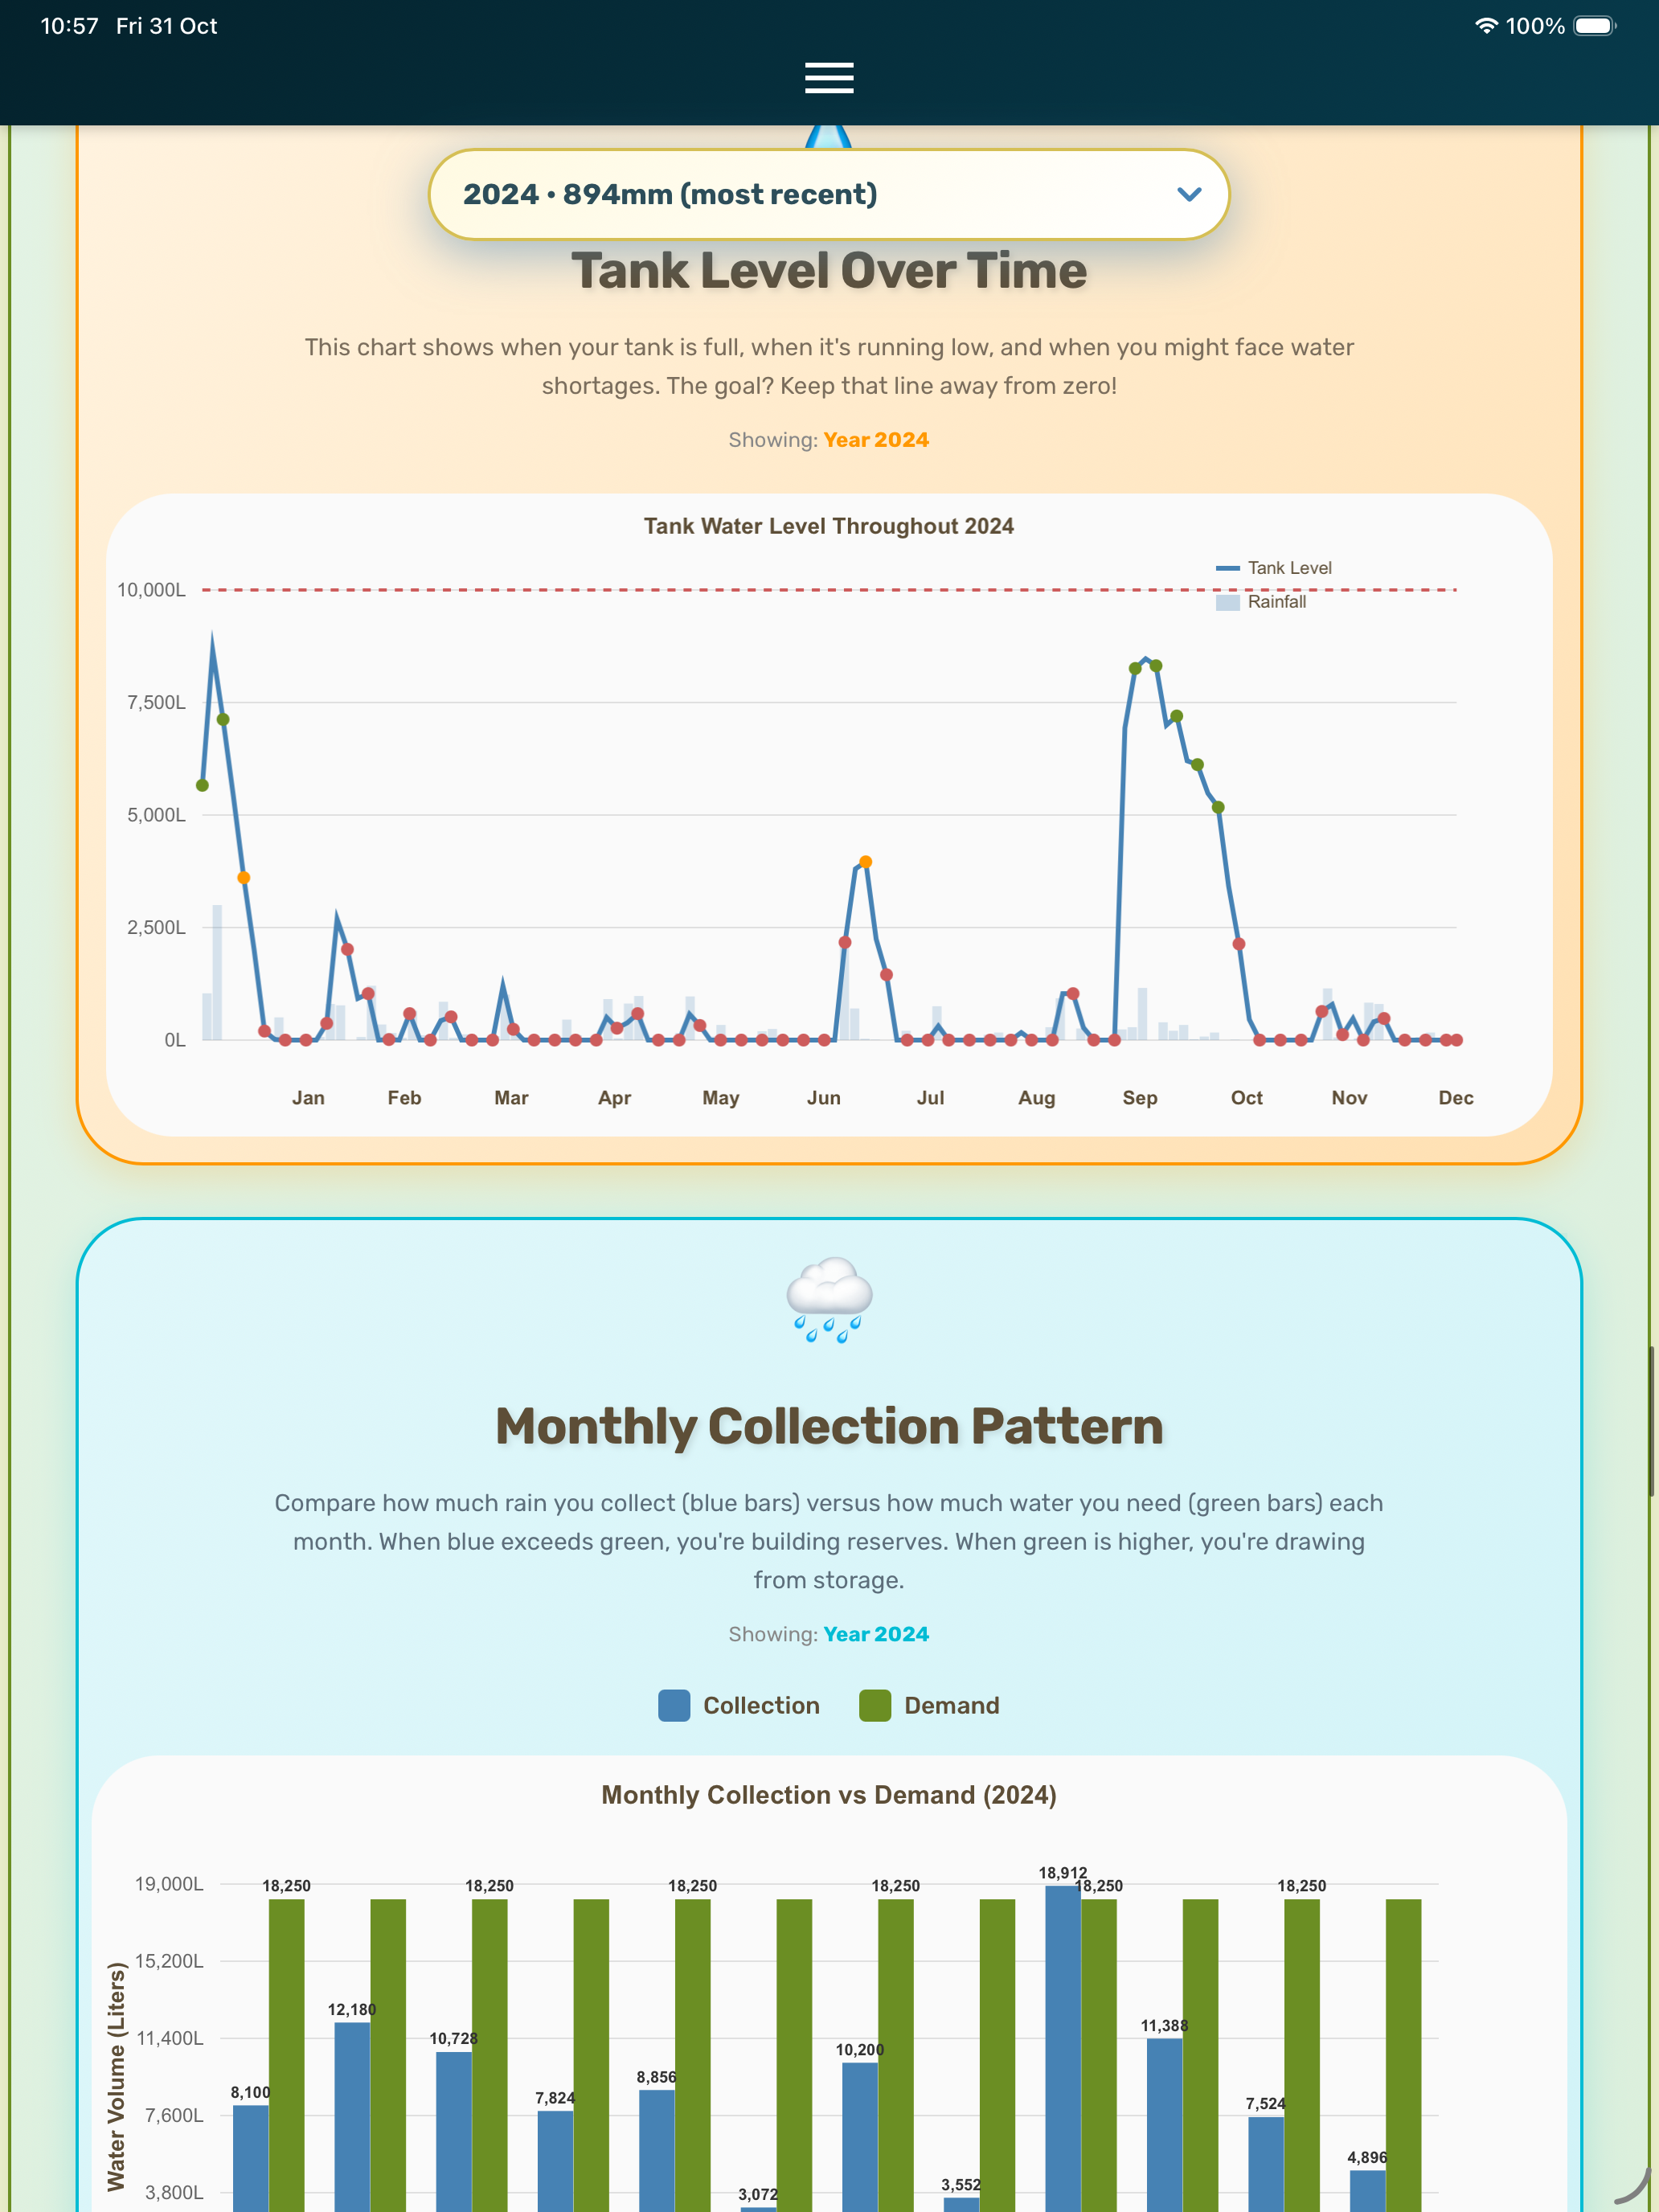
🔍 Drill Down to Daily Details
Click "View Daily Details" on any month and see:
- Full day-by-day breakdown
- Rainfall amounts
- Water collected
- Tank levels rising and falling
- Exact days your system failed
It's like watching your water system operate in fast-forward — spot problems before spending a penny.
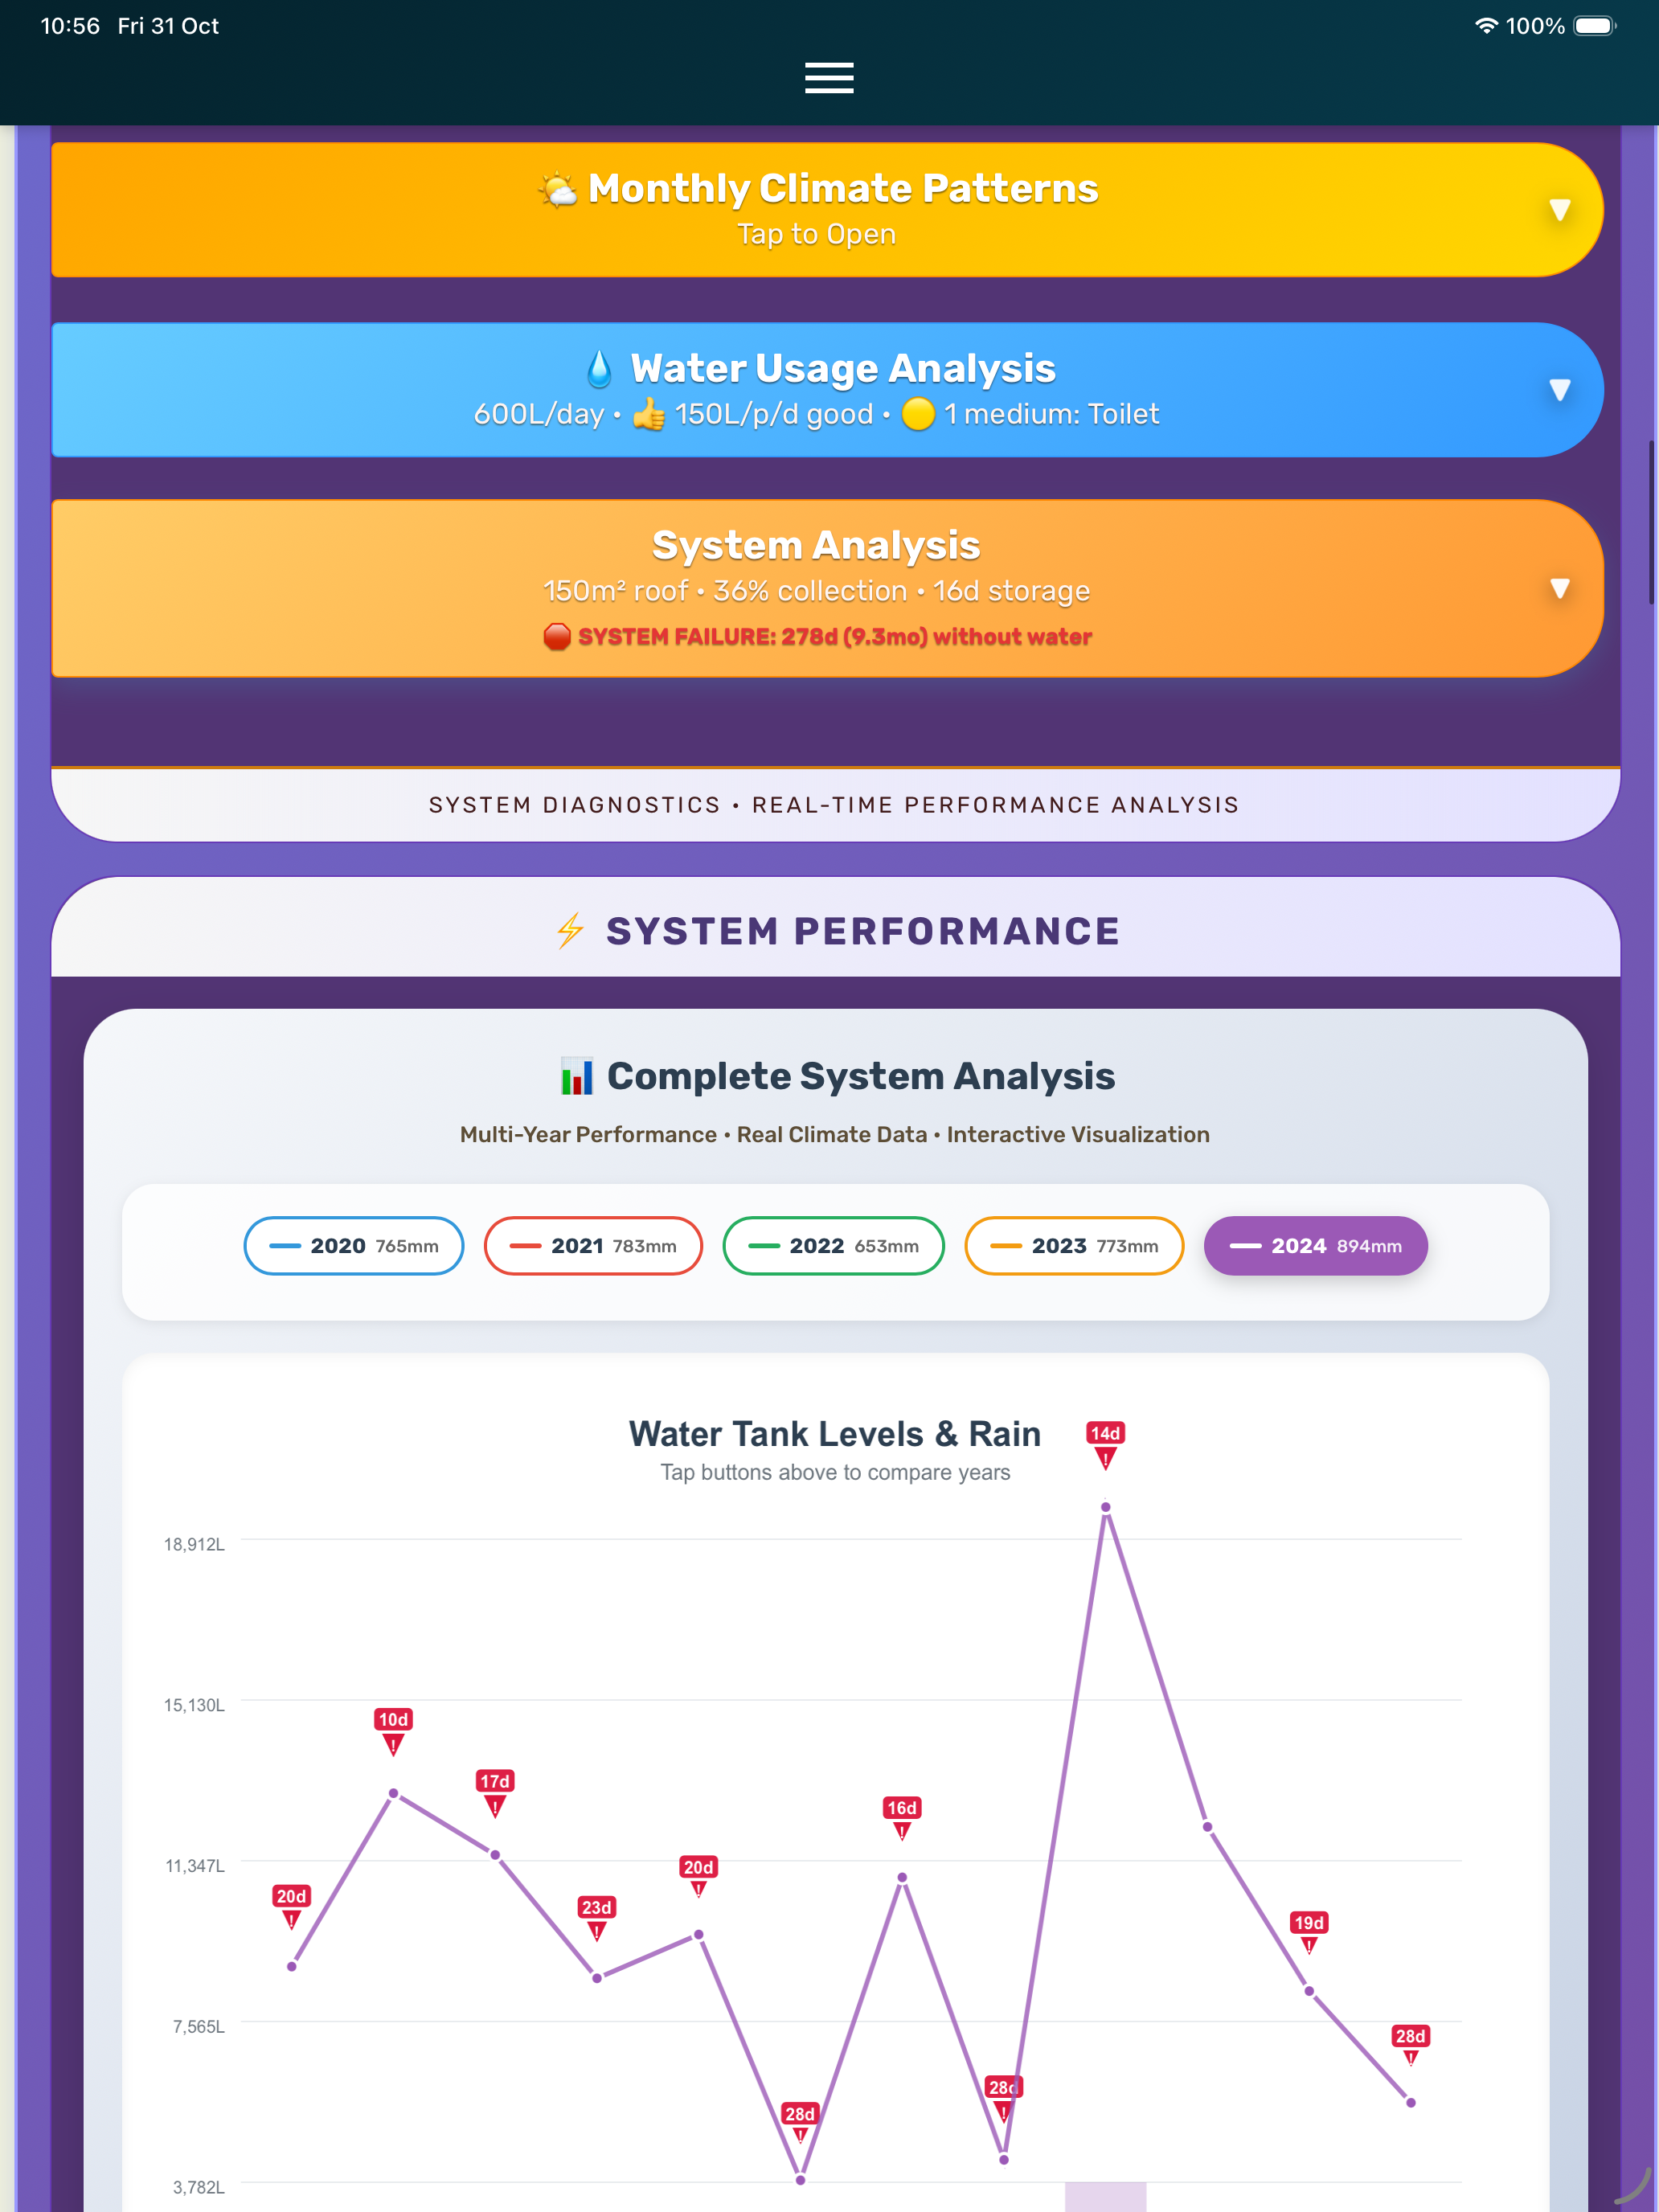
⚡ Interactive Year Comparison
Use the year selector dropdown to jump between years:
- Compare monsoon year vs. drought year
- Watch charts and tables update instantly
- See how 30% less rain in 2021 = 3 weeks without water
- Or how 2023’s deluge kept your tank overflowing for months
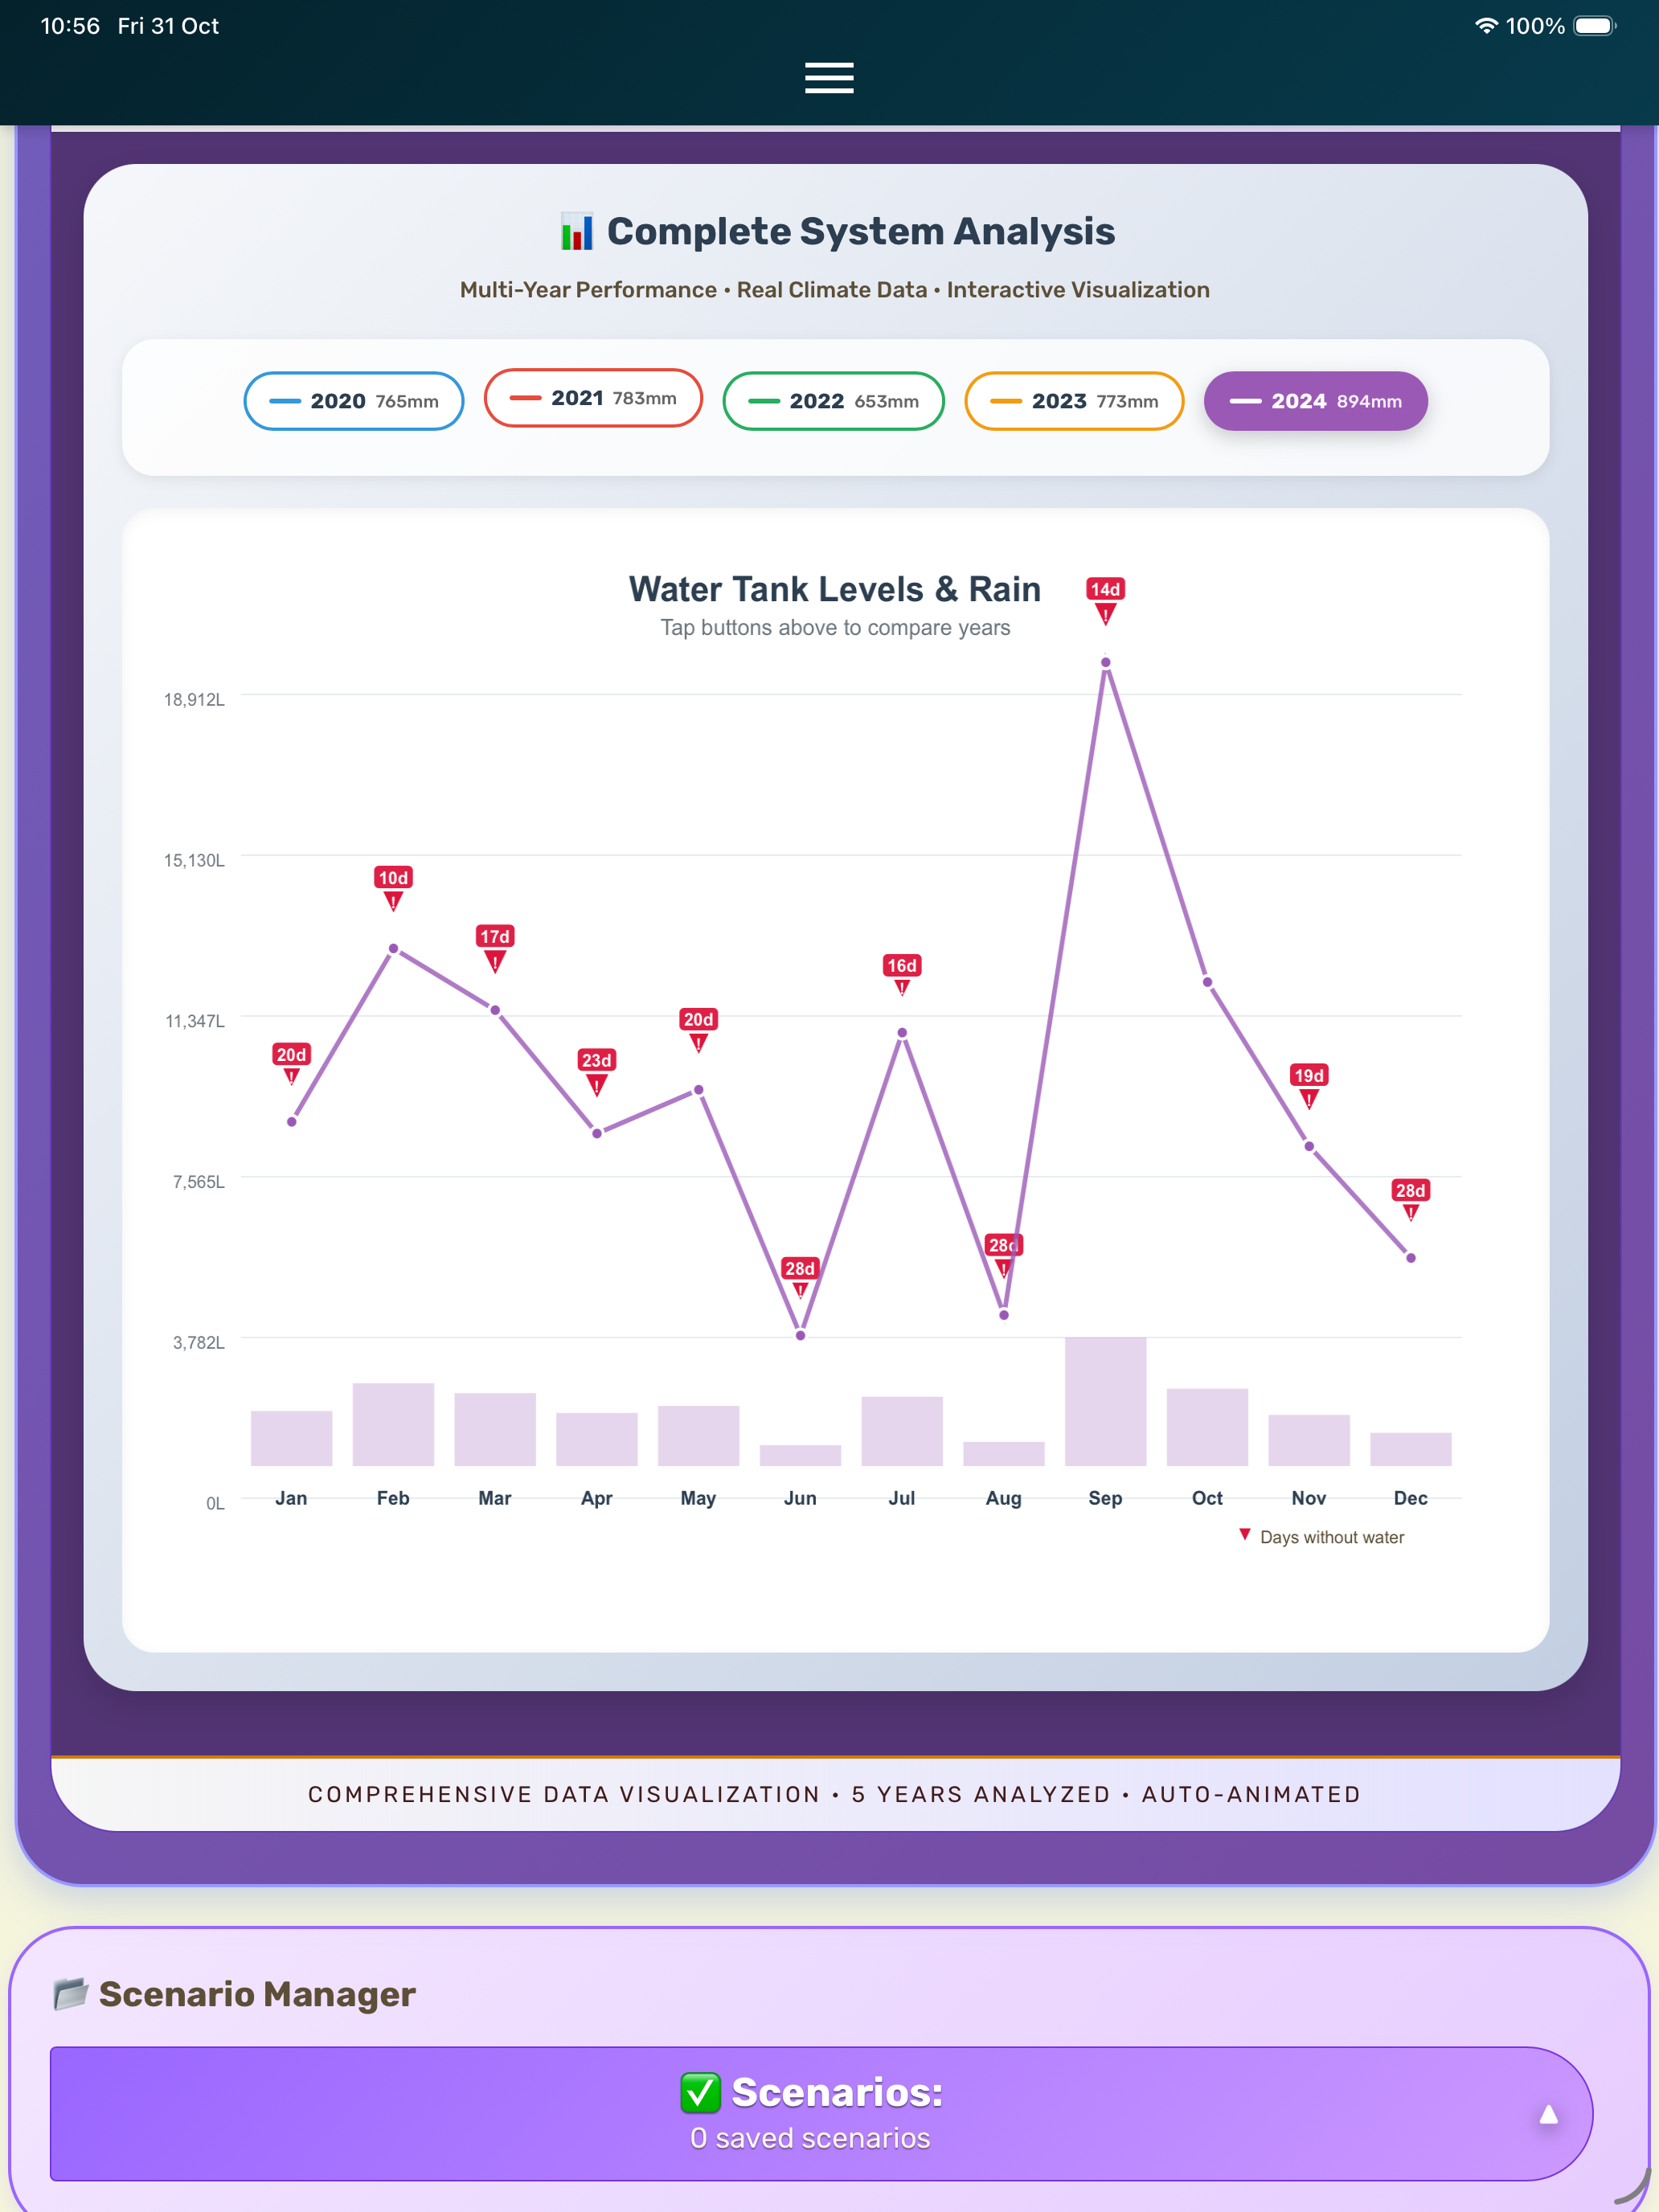
📈 Visual Insights That Make Sense
Beautiful, intuitive charts:
| Chart | What It Shows |
|---|---|
| Annual Rainfall Bars | Year-to-year variation |
| Reliability Trend Line | % of days with water across all years |
| Detailed Performance Table | Monthly rainfall, days dry, system status |
Color-coded:
- 🟢 Green = Plenty of water
- 🟠 Orange = Tight but OK
- 🔴 Red = Water shortage
🧮 Statistical Insights That Matter
The tool crunches the numbers:
- "Your worst year had 15% below average rainfall"
- "Year-to-year reliability variance: ±8% (moderately variable)"
- "Perfect track record: Zero days without water across all 5 years!" (if you're lucky!)
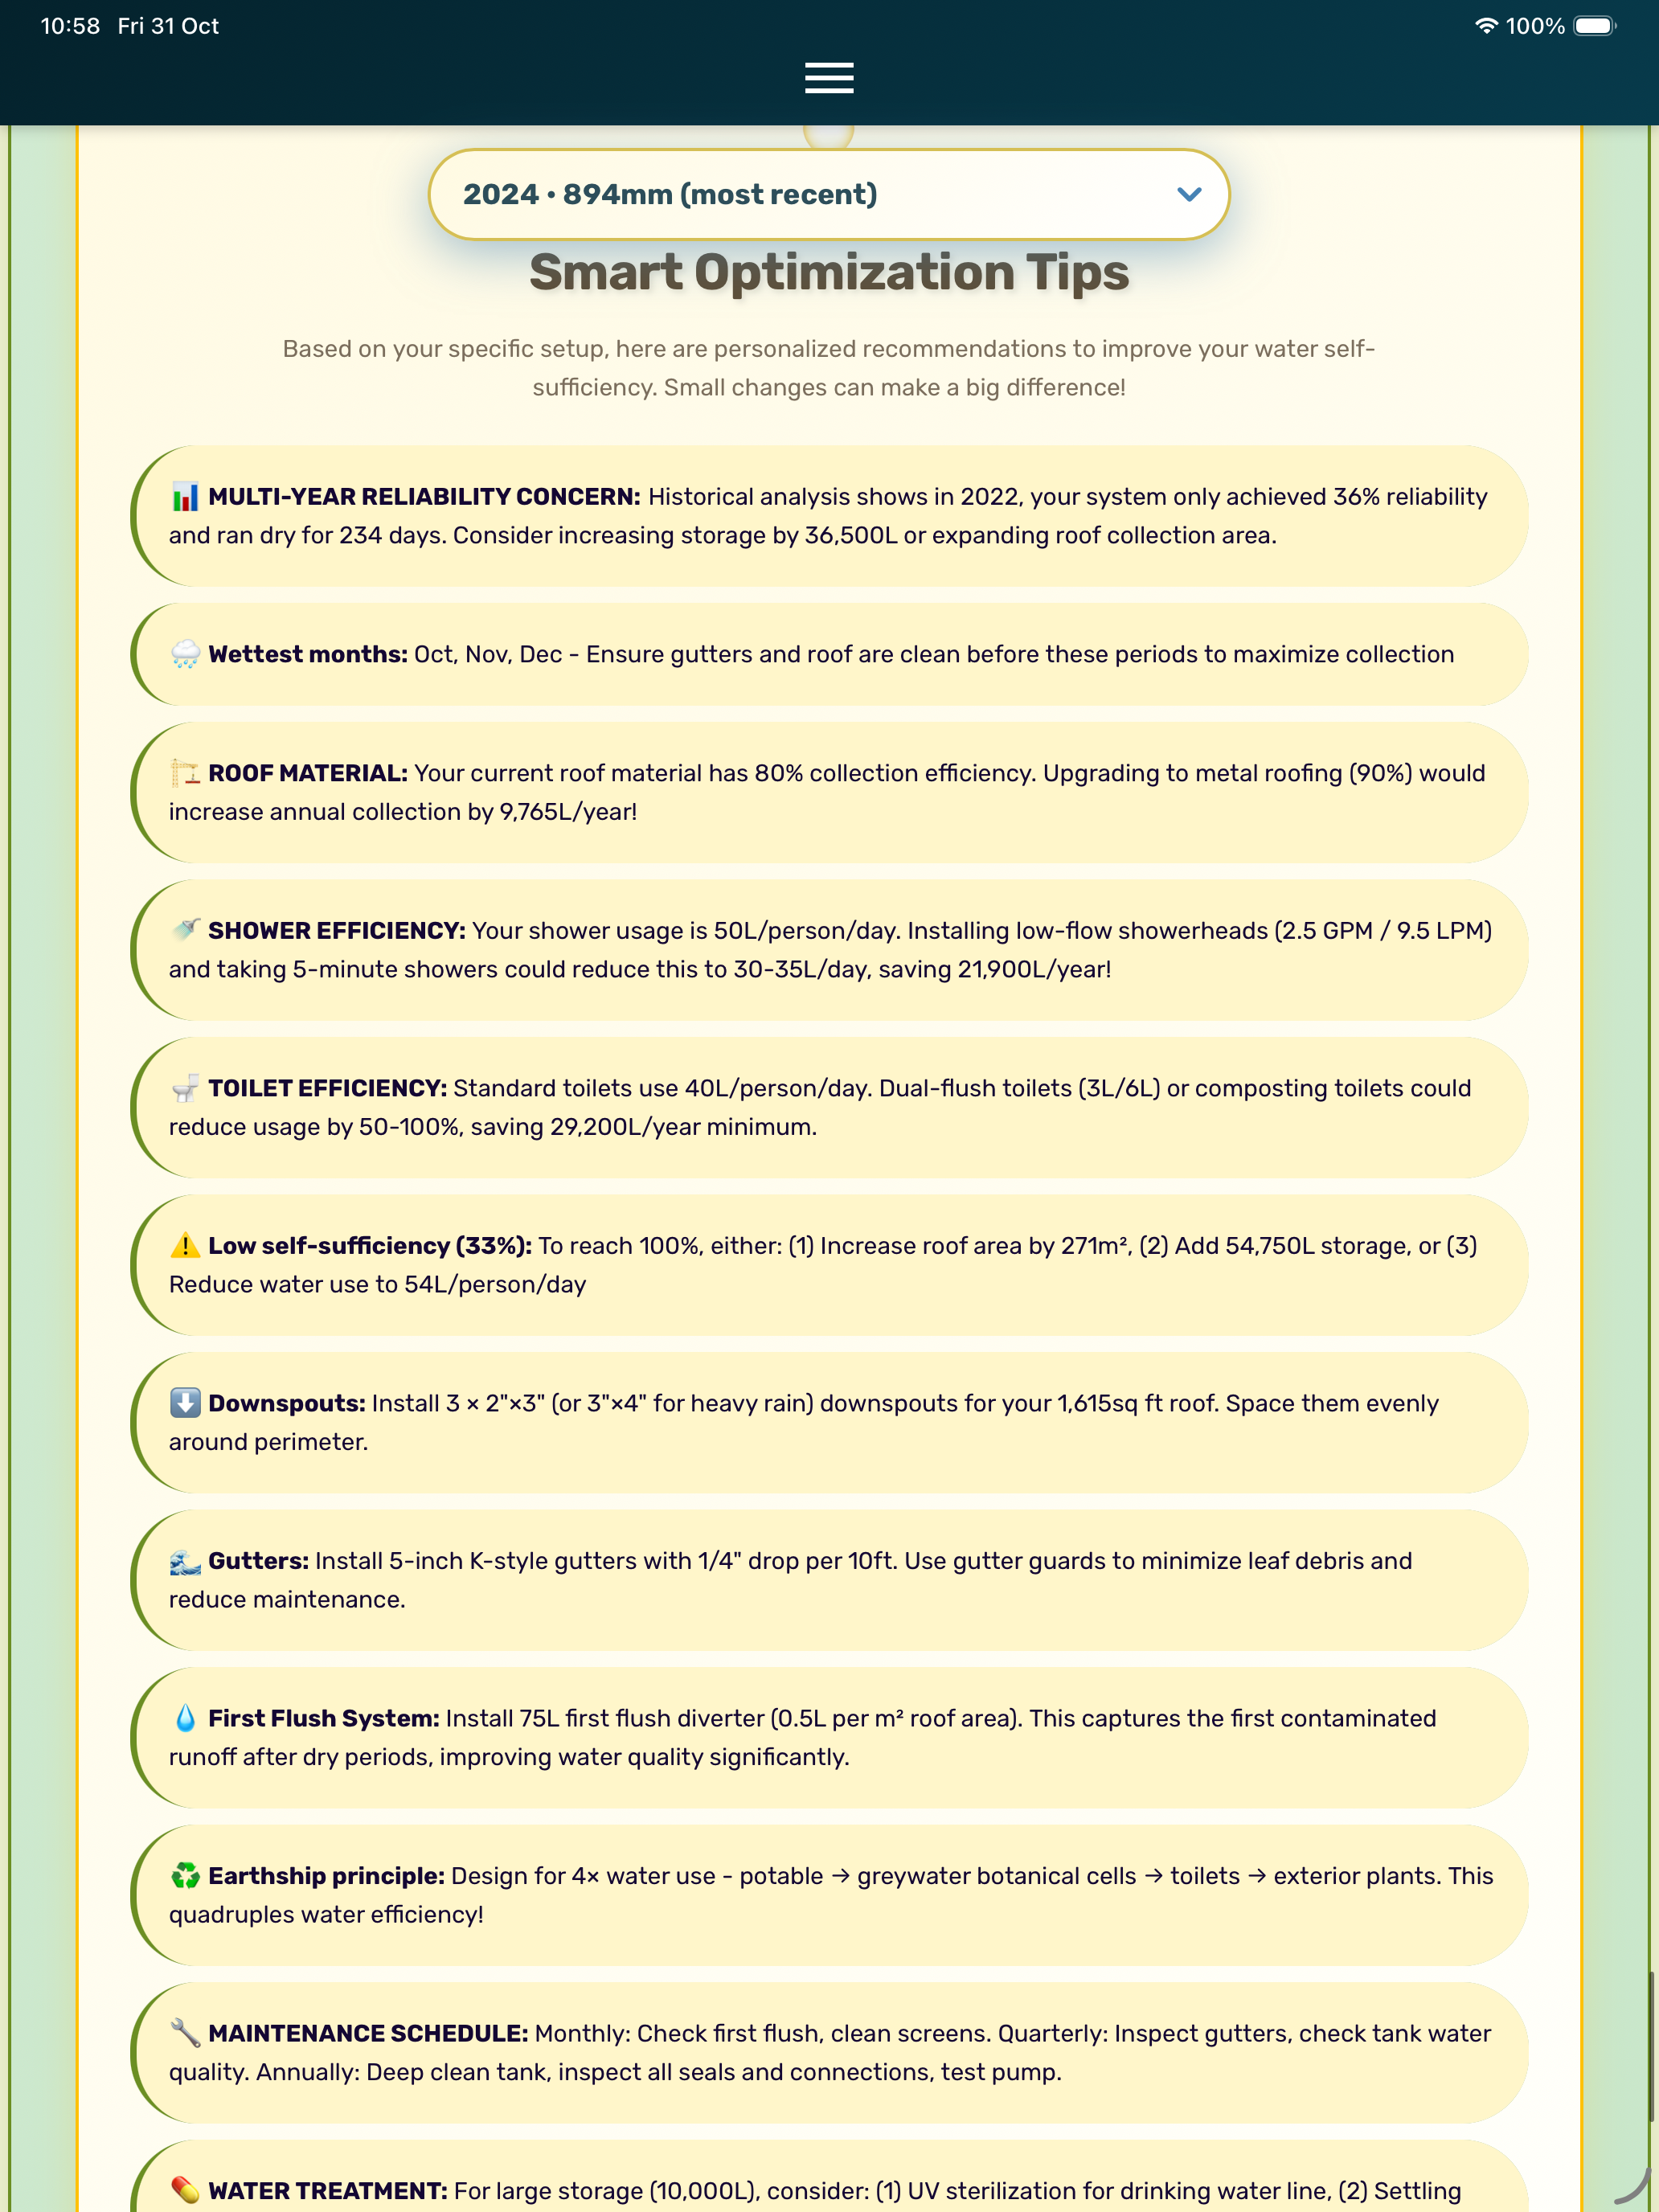
🛠️ But Wait, There's More: Optimization Tips
After showing you the problems, the tool doesn't leave you hanging.
Scroll down to Smart Optimization Tips — personalized advice based on your situation:
| Tip Type | Example |
|---|---|
| Location-Specific Wisdom | Koh Phangan’s 7–8 month dry season, monsoon prep, tropical tank selection, local suppliers |
| Storage Strategy | "Your 2-month buffer is risky. Increase to 5–6 months (32,000L) for drought security." |
| Multi-Year Reliability | "In 2021, only 78% reliability — ran dry for 80 days. Add 15,000L or expand roof area." |
| Water Usage Optimization | "Shower: 65L → 35L/day with low-flow heads = 43,800L saved/year!" |
| System Design | Downspouts, gutters, first flush, pumps, filters — tailored to your roof & rainfall |
| Seasonal Strategies | When to clean gutters, fill tank 100%, manage overflow |
| Maintenance Schedules | Monthly, quarterly, annual tasks |
| Water Treatment | UV, settling chambers, filtration — especially for drinking |
The Bottom Line
This isn't just a calculator — it's a:
- Risk assessment tool
- Design validator
- Teacher
It takes the guesswork out of rainwater system design by showing you exactly how your setup would have performed during recent years.
Want to know if that 10,000L tank is big enough?
→ Run the simulation.
Wondering if you can skip the second tank?
→ Check the worst-case year.
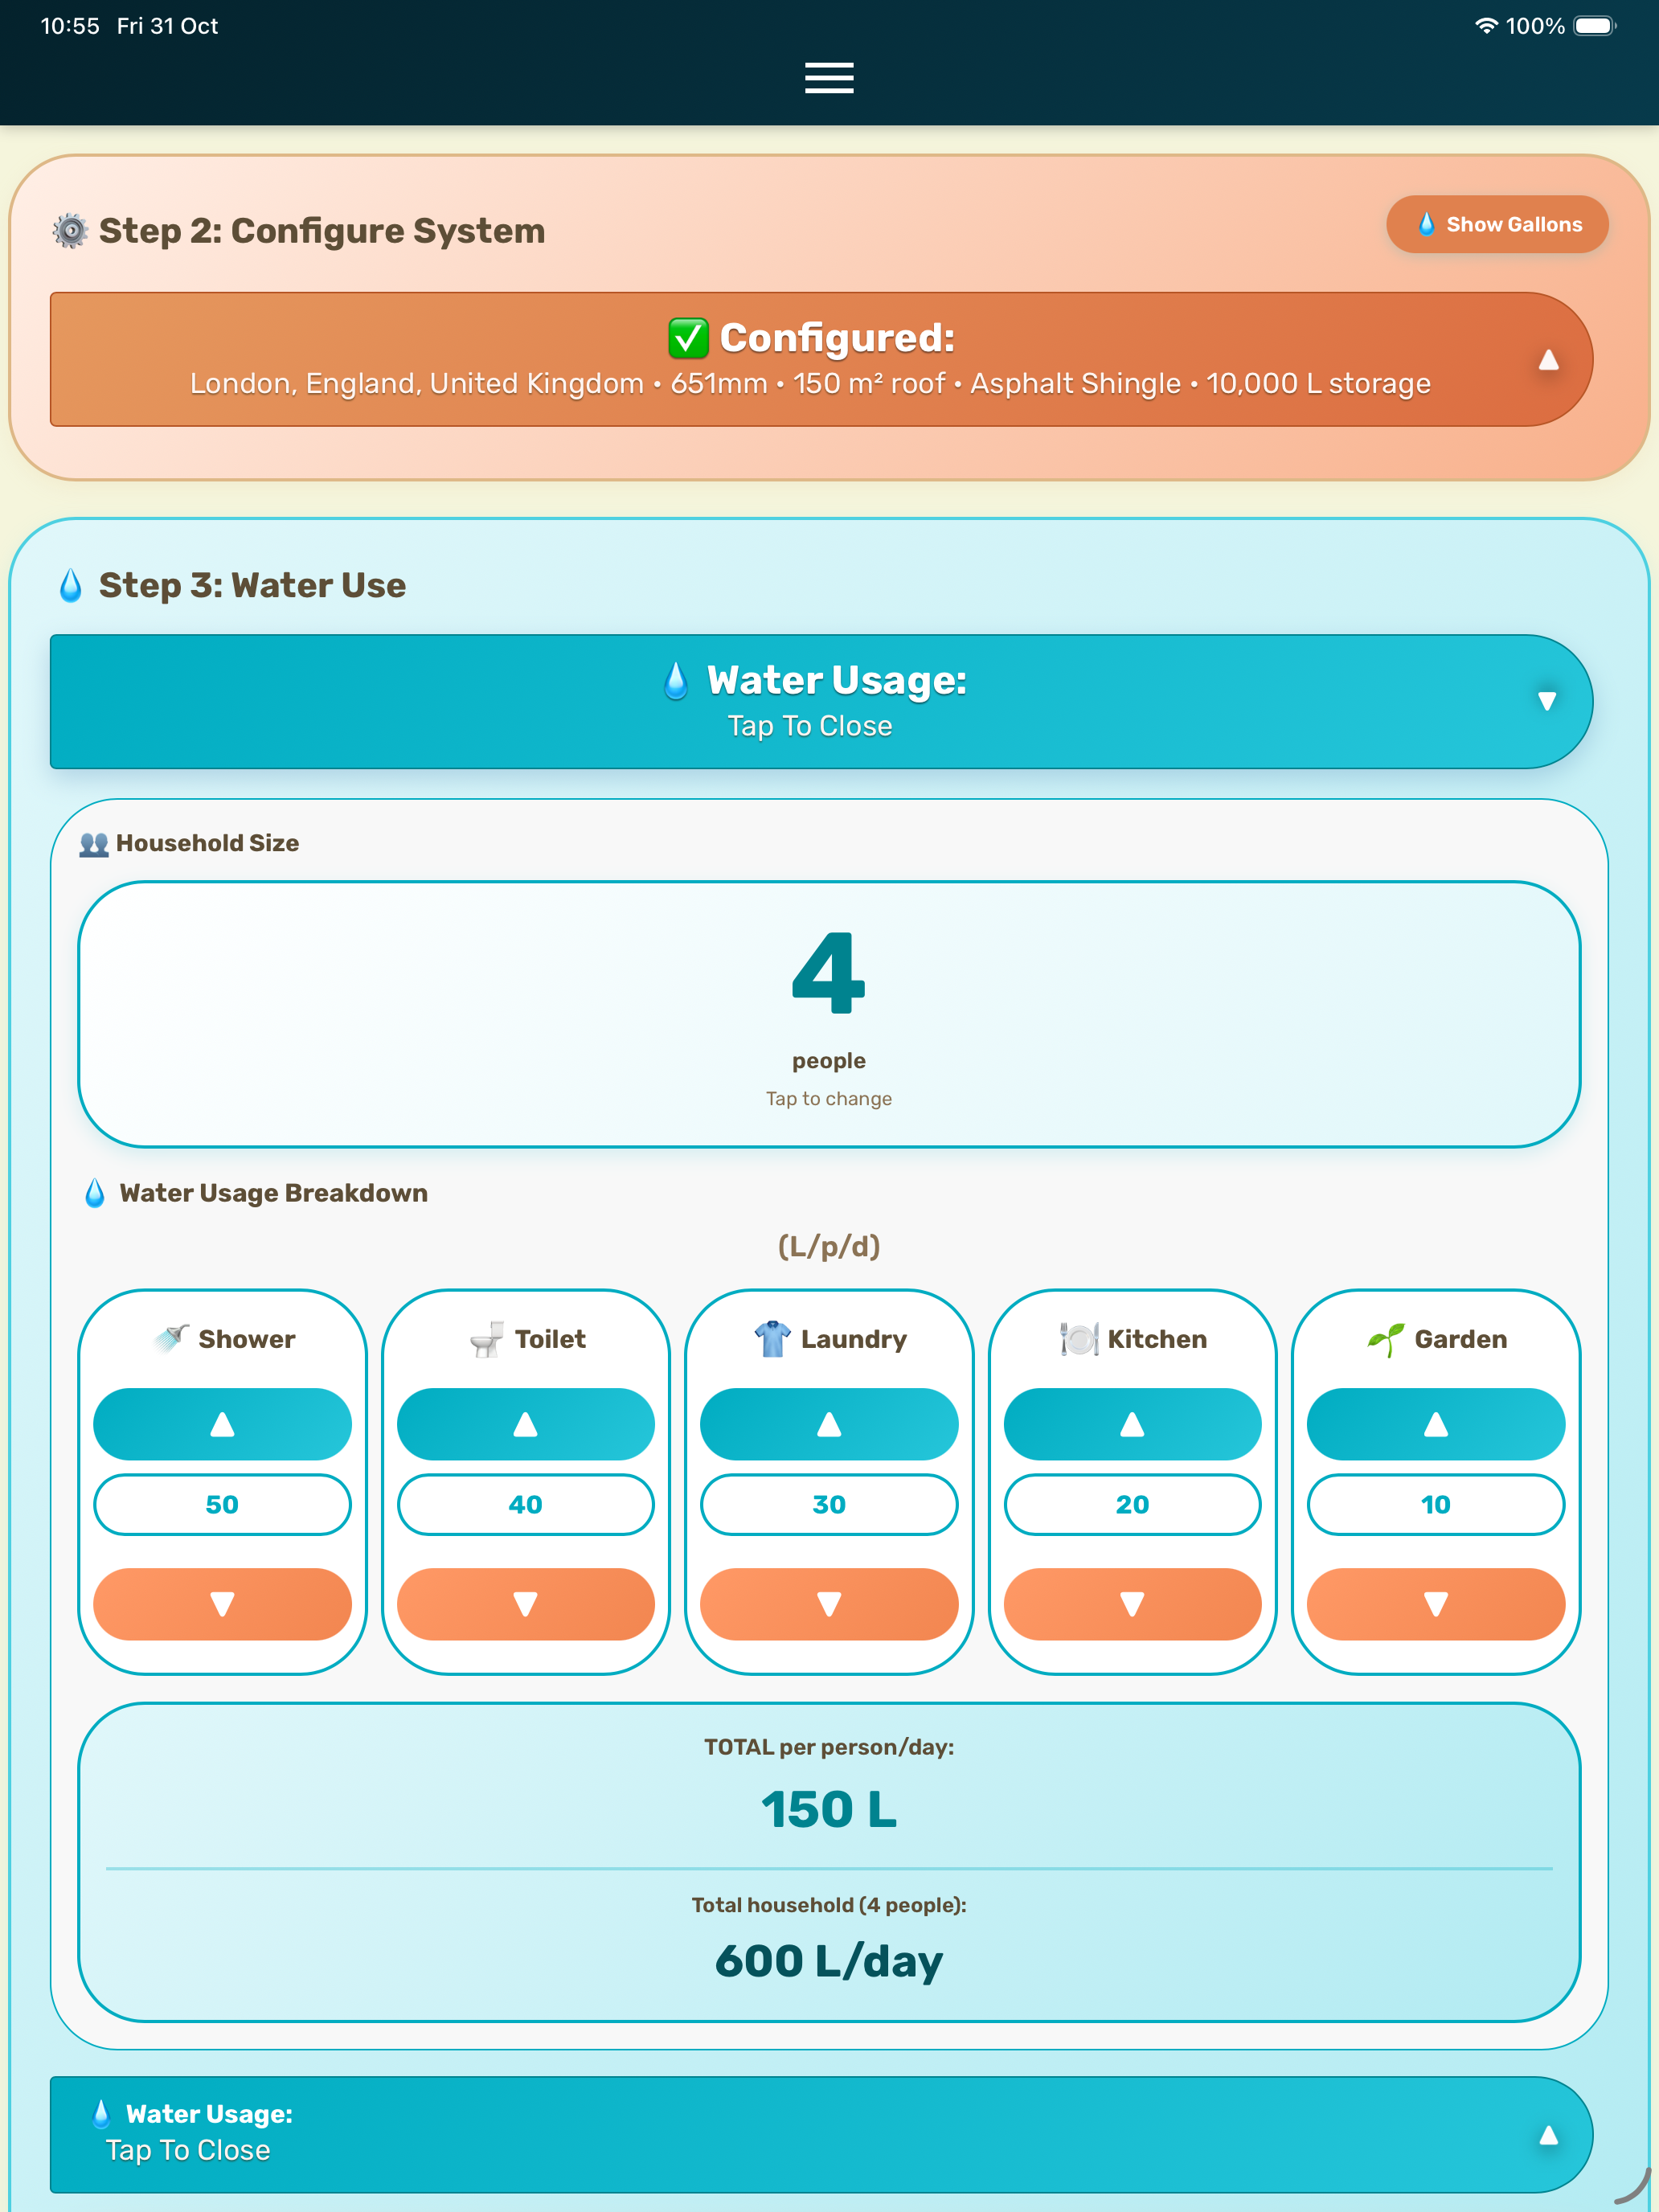
Curious if your family’s usage is sustainable?
→ The data doesn’t lie.
⏱️ In 5 minutes, you'll know more about your water system’s reliability than most people learn after years of trial and error.
That’s the power of real data, smart simulation, and design tools that actually care about whether your system works in the real world.
Ready to see how your system really performs?
%20-%202025-10-31%20at%2010.55.38.png)
%20-%202025-10-31%20at%2010.56.12.png)
%20-%202025-10-31%20at%2010.56.25.png)
%20-%202025-10-31%20at%2010.56.42.png)
%20-%202025-10-31%20at%2010.56.55.png)
%20-%202025-10-31%20at%2010.57.05.png)
%20-%202025-10-31%20at%2010.57.42.png)
%20-%202025-10-31%20at%2010.58.07.png)
%20-%202025-10-31%20at%2010.58.18.png)
Check it out here