XAUUSD (Gold) wave analysis: 4hr tf: Bearish bias
Previous post on Gold (XAUUSD) can be found here:
https://coinanalyst.investments/2018/05/13/xauusd-elliott-wave-analysis-4hr-tf/
It was mentioned in the previous post that the only bullish scenario that is favored would be after price closed above the topmost resistance line of ~$1325.73 in last week’s post.
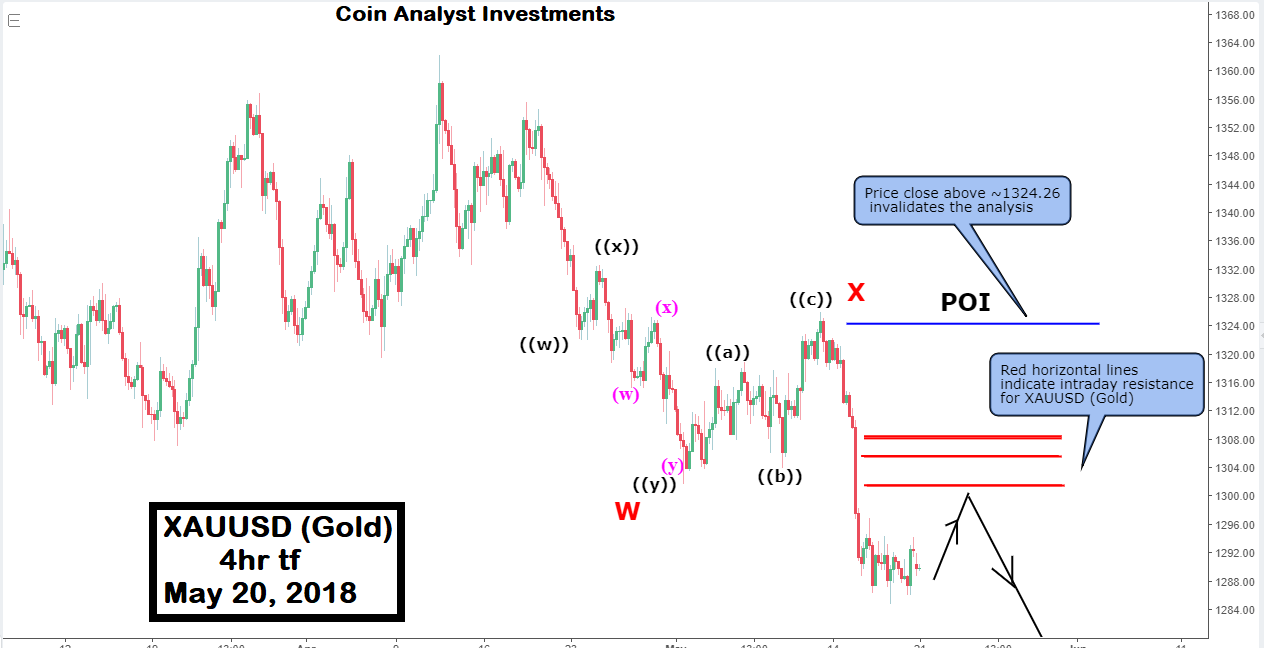
It was also mentioned that price breaking below ~ $1301.61 which is the low for XAUUSD on May 1, 2018 meant XAUUSD could possibly target ~$1251.97. Price swing from ~1352.19 (April17,2018) to ~$1303.84 on Ma 1, 2018 is identified in this analysis as a wave W of a double zigzag (W-X-Y) Elliott wave structure.
The 4hr tf as updated in this post that XAUUSD (Gold) could possibly reach ~1247.10 which is close to the target mentioned last week (~1251.97) for XAUUSD (Gold).
$1247.10 used here as a target is based on wave Y = 161.8% wave W, which is acceptable for a wave Y is a double zigzag Elliott wave structure.
Intraday target (resistance) is shown on the 4hr have been updated and are indicated by the horizontal red lines. Any bullish swing upwards is expected to target this region. Price level of the horizontal red lines are given below.
~1308.13 and 1308.43
~1301.47 and 1301.51
~1305.64 and 1305.57
Point of invalidation of the analysis (POI) is a price close above ~$1324.26 which would invalidate the formation of the Elliott wave structure described above.