Burned tokens, rewards, and inflation summary August 12, 2023: 221K SP, 149K STEEM, and 1,146 SBD burned in 68K burnsteem25 posts
Steemit launched the #burnsteem25 initiative on May 22, 2022 and the corresponding rewards started being delivered to @null on May 29. Here is the next weekly update with PowerBI charts to visualize the burned token-related statistics since those dates.
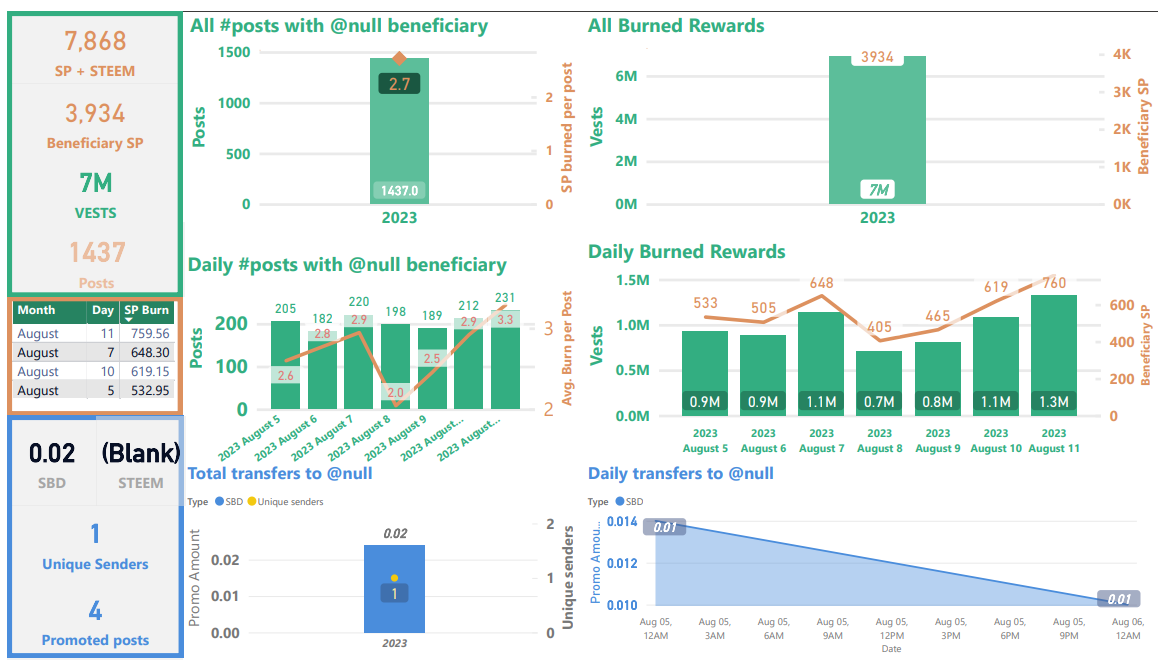
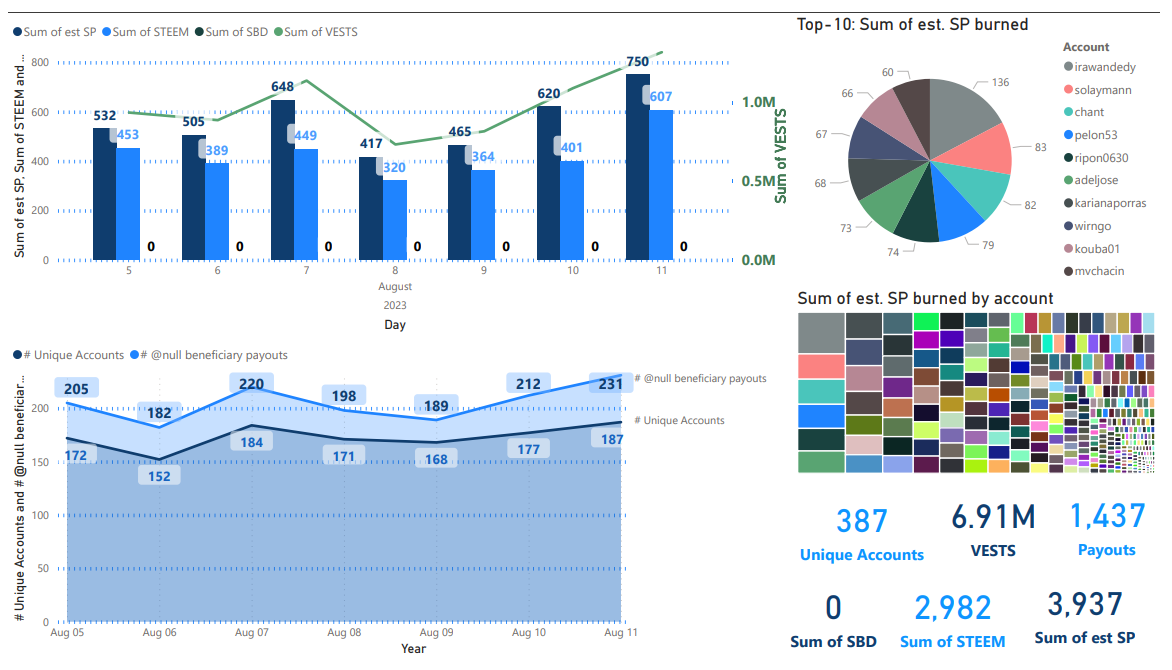
Slide 1 & 2: Burn amounts in beneficiary rewards and transfers to @null. (Weekly & All time)
According to data from steemdb, weekly totals were about 3,934 SP in burned beneficiary rewards and 0.02 SBD burned on promotion with 1,437 burnsteem25 posts (~2.7 SP burned per post).
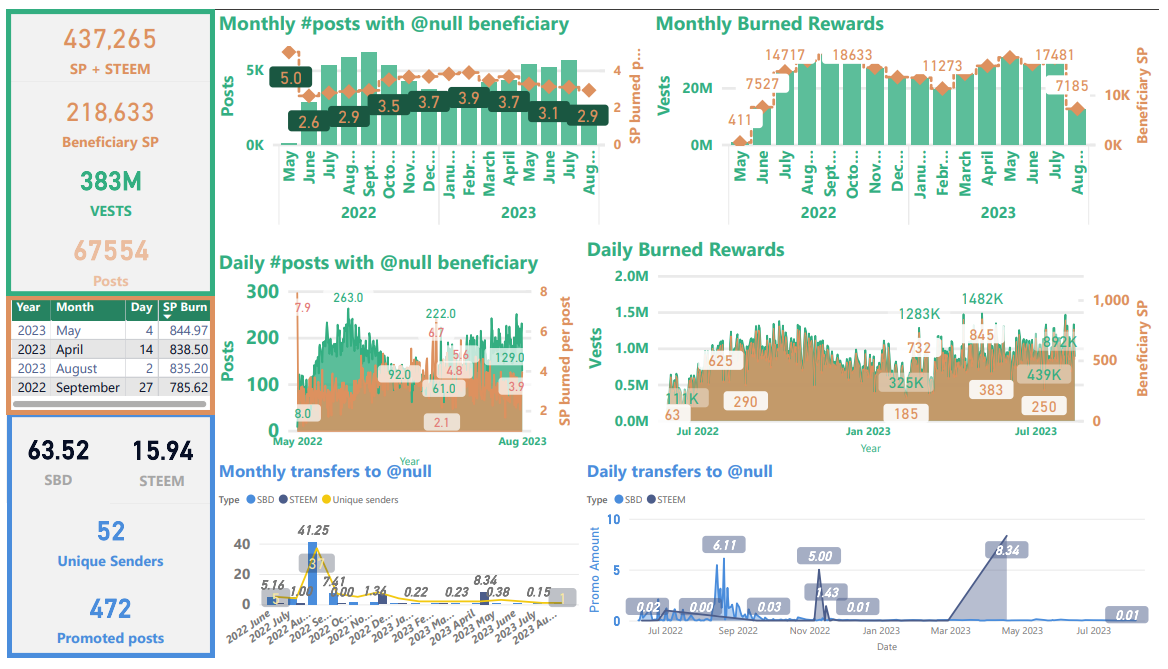
The numbers in these slides will differ slightly from the numbers in slides 5 & 7 because of different data sources and collection times. The numbers in slide 2 are artificially low due to some missing information in SteemDB from March 7 through March 14.
Weekly
May 29, 2022 to present (burnsteem25 era)
| Sidebars |
|---|
Top sidebar summary cards show total number of STEEM, SP, and VESTS burned, as well as the total number of posts with @null beneficiary settings. The STEEM + SP value is just an estimate, and it doesn't account properly for posts that are set to 100% power-up.
In the center-left sidebar is a new table showing the top-4 days in terms of burned beneficiary rewards.
Bottom-left sidebar summary cards show totals for SBD burned in post promotion.
| Graphs |
|---|
Top-left is a graph showing the number of posts and average SP burned per post by month.
Top-right: This shows the VESTS and the estimated SP beneficiary rewards burned per month.
Middle-left: This is a graph showing the number of posts and average SP burned per post, by day.
Middle-right: This shows the daily VESTS and the estimated SP beneficiary rewards that have been burned.
In all of the above graphs, VESTS are shown against the left axis, SP and STEEM are shown against the right.
Bottom: SBD transfers to @null. As readers are likely aware, SBD transfers to @null can get a post added to the /promoted page. The visualization on the left shows a monthly aggregation of SBDs transferred and a count of unique senders. The visualization on the right shows the daily record.
Slide 3: Rewards summary
Unchanged since August 21, 2022, SBD printing has remained paused. With the present SBD supply, it looks like the median on-chain price for STEEM needs to get back to about $0.252 for SBDs to start printing again. The current median price is $0.184. The burn ratio shows at 2.0%, which is the same as last week's value of 2.0%. It should be noted that this estimate doesn't account properly for 100% powerup posts, so the percentage should be thought of as an upper boundary, rather than an exact number.
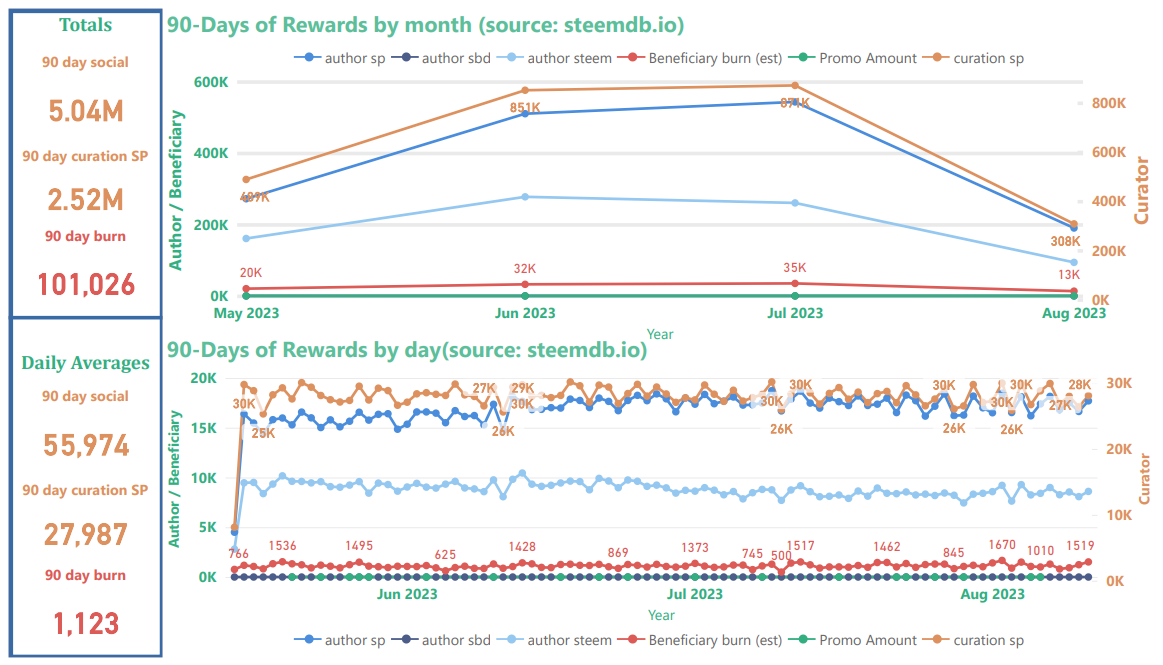
Curator rewards use the scale on the right, author and beneficiary rewards use the scale on the left. Thus, curation rewards appear to be scaled down relative to author & beneficiary rewards. Beneficiary rewards for @null in this chart (red) have been adjusted in order to account for both SP and liquid rewards, but it does not account properly for 100% power-up posts. The top graph shows the monthly aggregations, and the bottom graph shows daily totals.
The top-left sidebar shows estimates for the 90-day total of distributed "social rewards" (author, curator, and beneficiary), the 90-day total of curation rewards; and the 90-day total of burned beneficiary rewards.
The bottom-left sidebar shows estimated daily 90-day averages for the same three values. In both sidebars, "social rewards" are calculated as [curation rewards] * 2. Based on these estimates, the burn rate is about 1.9% of all social rewards (this excludes interest paid for staking, rewards to witnesses, and SBDs to the SPS). This estimate, however, does not account for posts that are set to power-up 100% of rewards.
Slide 4: STEEM & SBD Supply as well as vested (i.e. staked or "powered up") STEEM
Noteworthy this week is that liquid STEEM as a percentage of current supply and of virtual supply increased for the fourth week in a row (top-right and bottom-left charts). Also, the current observed inflation rate is now running around 6.57%, which is down from 6.58% last week and down from 6.89% when I started tracking it on November 26, 2022. The value has ranged from 6.57% to 6.89% since I started tracking it.
Recent update: An average observed value for new STEEM per day was added in the middle row of the slide visuals. Nearly all of the difference between observed and predicted values is accounted for by burned beneficiary rewards and missed blocks.
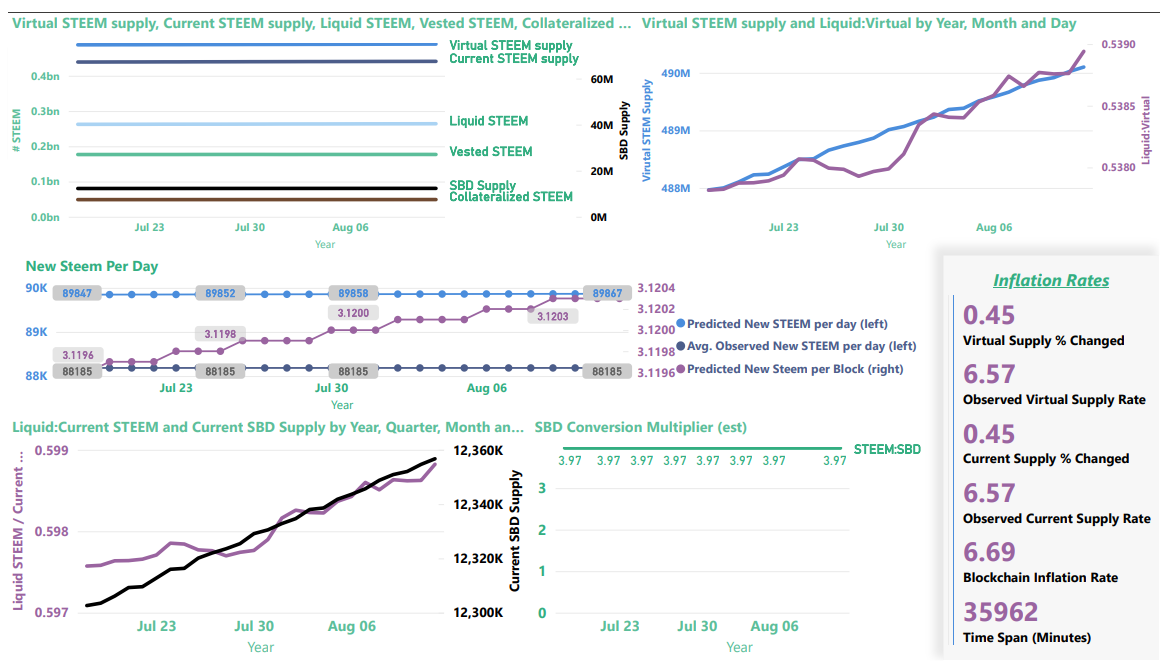
The card in the lower-right corner shows the inflation rates for current_supply and virtual_supply, as calculated from the SteemDB API. It also shows the blockchain's current internal inflation rate.
The top-left image provides a summary view of current and virtual STEEM supply, current SBD supply, liquid and vested STEEM, and the amount of STEEM reserved as collateral for paying off SBDs.
| Note |
|---|
Collateralized STEEM and current SBD supply actually represent the same value expressed in terms of STEEM or SBDs, respectively. They're aligned differently on the graph because they use different axes. |
The top-right graphic now contains a zoom-in on "virtual STEEM Supply" (left axis) and the ratio of liquid STEEM / virutal STEEM supply (right axis). As we learned, here, virtual STEEM supply is heavily influenced by price, so with STEEM prices down, it's not surprising to find the virtual STEEM supply increasing. The up-side of this is that it's now possible to burn more collateralized STEEM per SBD with post promotion.
The line graph in the center shows the current inflation in terms of new STEEM per block and new STEEM per day. The slopes of those lines should be identical, since one is a multiple of the other, but they look different because of the different scales from the primary and secondary axes. These are calculated using the formulas from Steemit Corner #2 : Understanding Steem Inflation. As-of July 15, 2022, a value for observed new STEEM per day has also been added. This is calculated as an average from SteemDB.io. The first virtual_supply value is subtracted from the last virtual_supply value, and the difference is averaged over time. At present, I don't fully understand the reason for the difference between the observed daily value and the predicted daily value, but most of the difference can be explained by burned beneficiary rewards and missed blocks.
The bottom-left visualization now contains the ratio of liquid STEEM / current STEEM supply (left axis) and a zoom-in on Current SBD supply (right axis)
The chart on the bottom right shows the value of SBDs in terms of STEEM, according to the blockchain conversion rate, not external markets. This is the inverse of the blockchain's: internal price, as explained here.
Now, here are some more details about each of the values
| Parameter | Axis (left/right) | Meaning | Comments |
|---|---|---|---|
| SBD Supply | right | Number of SBDs in circulation | Equivalent in value to collateralized STEEM |
| Collateralized STEEM | left | Number of STEEM needed to pay off all SBD debt | Equivalent in value to SBD Supply |
| Vested STEEM | left | Number of STEEM staked as STEEMPOWER | |
| Liquid STEEM | left | Number of STEEM that's not staked or needed for SBD collateral | Calculated as (Current STEEM supply - Vested STEEM) |
| Current STEEM supply | left | Number of STEEM in circulation | |
| Virtual STEEM supply | left | Number of STEEM in existence |
Slide 5-8
Instead of using steemdb.io, here are the newer visualizations - straight from the blockchain's API. These cover the last week, the last month, the full burnsteem25 era, and throughout the entire blockchain's lifetime.
Since these graphs come straight from the blockchain API, they should not be affected by the above-referenced problem with missing data.
Last week
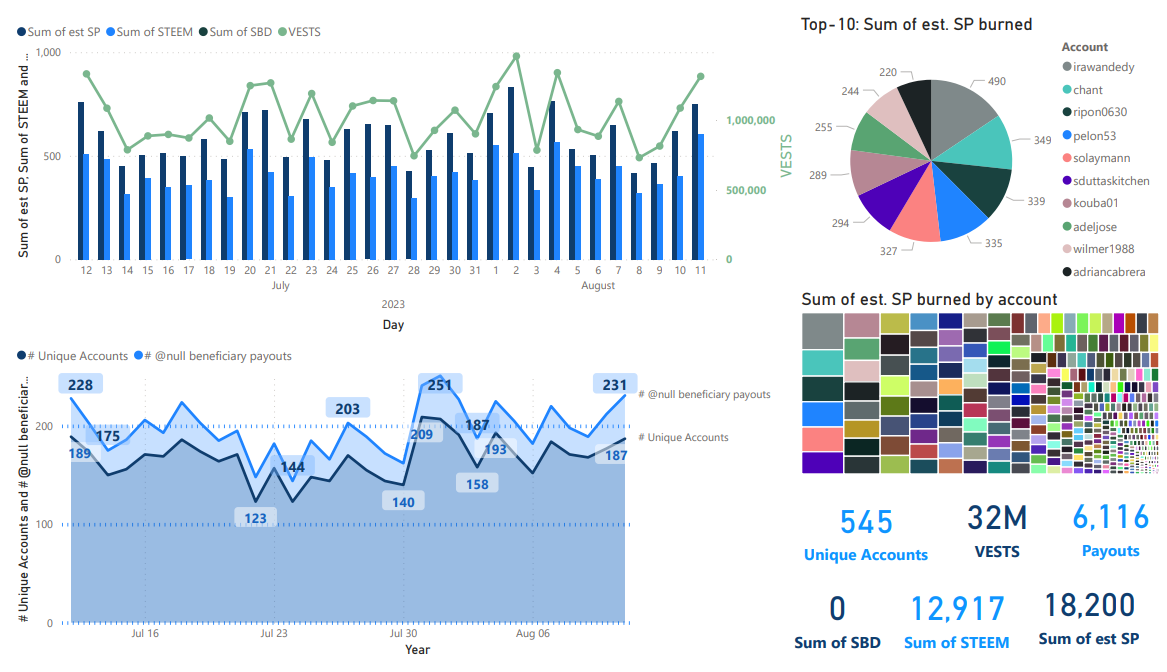
Last month
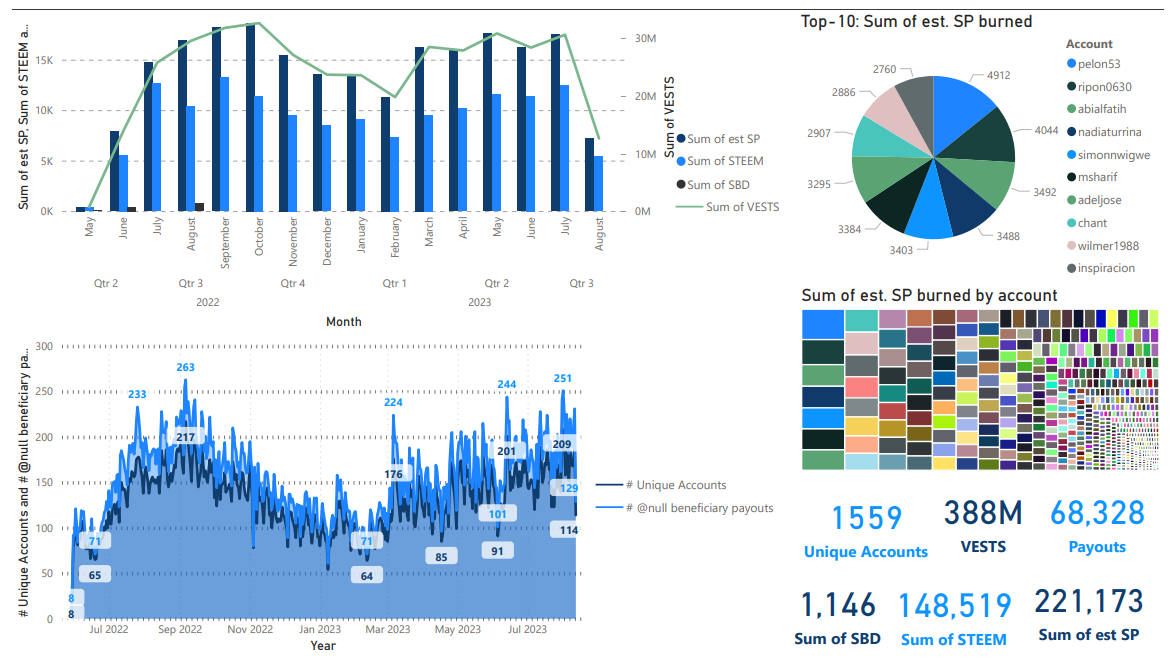
May 29, 2022 to present (The burnsteem25 era)
All time
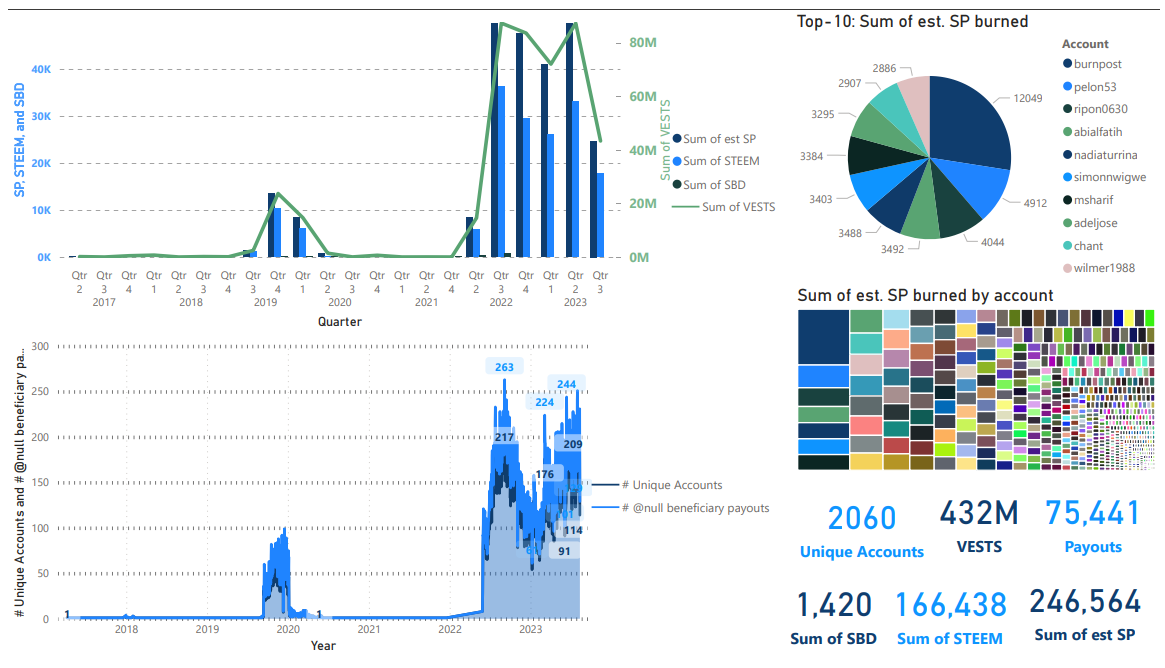
In a surprise reshuffling of the all time leader board, @steemitblog dropped out of the top-10 after being passed by @chant and by @wilmer1988.
Lastly
Since I've been looking at inflation information as part of this series, here's a new visualization that is directed towards the pending rewards (top) and the overall rewards pool (bottom).
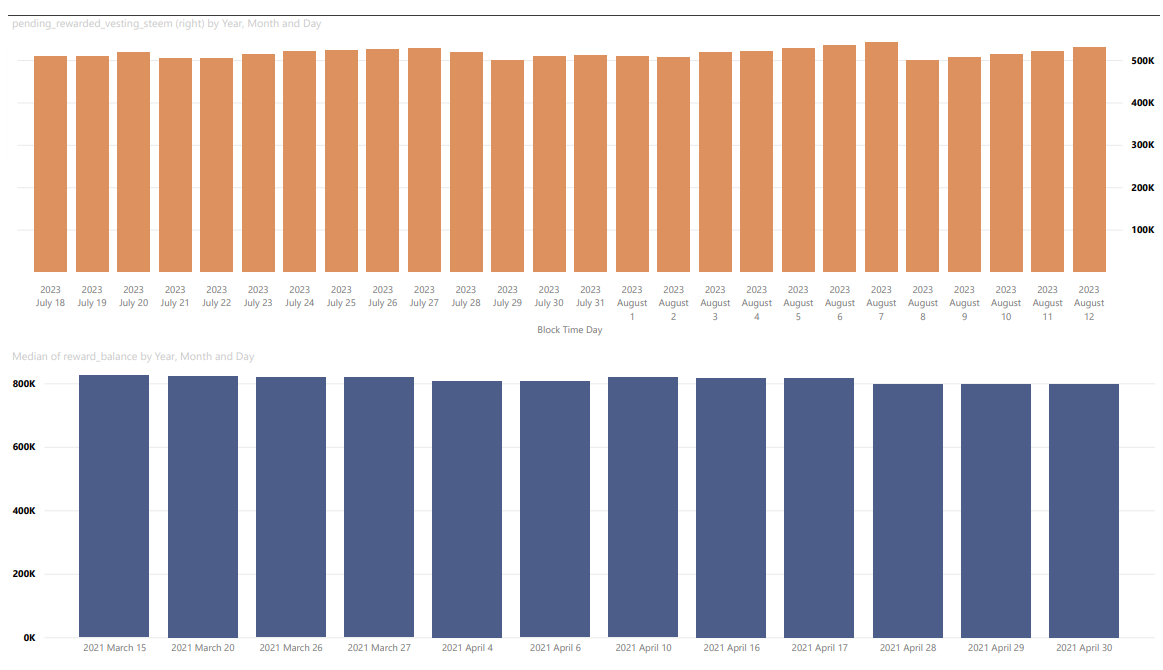
I won't be updating this or including it every week unless/until the SteemDB funds API gets updated, but I wanted to save the historic version. Note that the pending rewards (top) are current, but the rewards pool information (bottom) is from April of 2021, and the rewards balance at the time was about 800K. If we look at the reward_balance in the present, the numbers are more like 900K. I just wanted to save a record of the change, but I won't be able to provide fresh numbers unless/until the API gets updated.
Thanks for reading!
Previous weeks
- Burned tokens, rewards, and inflation summary August 5, 2023: 217K SP, 145K STEEM, and 1,146 SBD burned in 67K burnsteem25 posts
- Burned tokens, rewards, and inflation summary July 29, 2023: 212K SP, 142K STEEM, and 1,146 SBD burned in 65K burnsteem25 posts
- Burned tokens, rewards, and inflation summary July 22, 2023: 208K SP, 139K STEEM, and 1,146 SBD burned in 64K burnsteem25 posts
- Burned tokens, rewards, and inflation summary July 15, 2023: 204K SP, 137K STEEM, and 1,146 SBD burned in 63K burnsteem25 posts
- Burned tokens, rewards, and inflation summary July 8, 2023: 200K SP, 134K STEEM, and 1,146 SBD burned in 62K burnsteem25 posts
- Burned tokens, rewards, and inflation summary July 1, 2023: 196K SP, 131K STEEM, and 1,146 SBD burned in 60K burnsteem25 posts
For links to updates from 2022 and the first half of 2023, see:
- Burned tokens, rewards, and inflation summary June 24, 2023: 192K SP, 128K STEEM, and 1,146 SBD burned in 59K burnsteem25 posts
- Burned tokens, rewards, and inflation summary December 31, 2022 - Total burn estimates: 207K STEEM/SP and 64 SBD

Pixabay license, source
Reminder
Visit the /promoted page and #burnsteem25 to support the inflation-fighters who are helping to enable decentralized regulation of Steem token supply growth.
Sorry to be off topic, but I want to give you one quote from the Steemit team:
Consider becoming a Representative. It won't cause you any extra work. I believe that among the representatives there should be someone who understands programming and remembers the "old Steemit". We all want the platform to grow. Let's try to do something, at least very small steps, what we can.
If you mean remlaps as a community curator, may it would be one of the best decision for general users and also steemit. Don't wanna comment about remlaps interest. But I think it would be great.
I agree with you.
Thanks for mentioning it! I did spend one month as a community curator with the steemcurator07 account back in 2020, but then my employment situation changed and I had to withdraw. Unfortunately, with my current situation, I can't really do it any more. I just can't count on myself to be as consistent & reliable as I would need to be to take on a commitment like that.
I understand this perfectly, now I often fall out of online life.
My proposal is not to participate in the curatorial team. It's something fundamentally different.
Curatorship is important, but what really makes a business grow, a panel, a platform are the users and their constant interaction, it is similar to summoning people to do a class, if people don't come there is no class, the human factor It is the most important thing in my opinion and of course the commitment ,is my humble opinion.
Thanks for the analysis. There is a decrease in steem burn this week. Sp burning per post decreased. The previous average was around 3.3.
This is a complete report with graphs and information. Here also previous report link included so anyone can see or check the previous records too. Thanks for sharing such informative blog. Will waiting for next one!!
As usual a very informative post here from remlaps. May be it is the one of the best magazine about steem sbd and also for steemit. Thanks for your continuous good job.
Over the last four weeks, I see that the total SP burned has ranged between 4K and 4.3K. I hadn't noticed the decline in SP per post, though. You're right that the SP per post was a bit lower last week.
Hope #burnsteem25 really helps steem grow!