Trading Steem with Harmonic Patterns.
Hello everyone I am excited to participate in this weeks contest where we will explore harmonic patterns to predict potential price reversals. In this post I will be analyzing the Steem/USDT trading pair using patterns like the Gartley Bat Crab and Butterfly. These patterns help trader like me spot possible market reversal by using Fibonacci retracement and extension levels.
Through this post I will explain how I identify these patterns on the chart and how they can guide us to make better trading decisions. My goal is to showcase how harmonic pattern can be applied in real trading scenarios and help predict future price movement.
.png)
Key Harmonic Patterns: Gartley, Bat, Crab, and Butterfly |
|---|
Harmonic patterns are advanced tools that help traders like me predict posible price reversals in the market by using Fibonacci retracement and extension levels. These pattern are based on specific Price movement that Follow certain Fibonacci ratios making them great way to spots when the market might reverse direction. Let me explain the four main harmonic patterns Gartley Bat Crab and Butterfly in details along with how I use them to analyze the Steem/USDT pair.
1. Gartley Pattern
The Gartley pattern is one of the most popular harmonic patterns. It usually forms when the price makes sharp movement (XA) then pulls back (AB) move up again (BC) and finally makes another pullback (CD).
.png)
Fibonacci Levels:
- The AB leg retraces to 61.8% of the XA leg.
- The BC leg extends to 38.2%–88.6% of the AB leg.
- The CD leg moves toward 78.6% of the XA leg.
How It Works: The pattern signals that the price might reverse direction once it reache the D point. This is where I look to enter a trade. In the Steem/USDT pair the Gartley pattern can help me identify when the price is likely to stop falling and start going up again.
Example: Think of it like car speeding down a hill (XA) hitting the brakes halfway (AB) speeding up little (BC) and then slowing down again near the bottom (CD) before turning back up the hill.
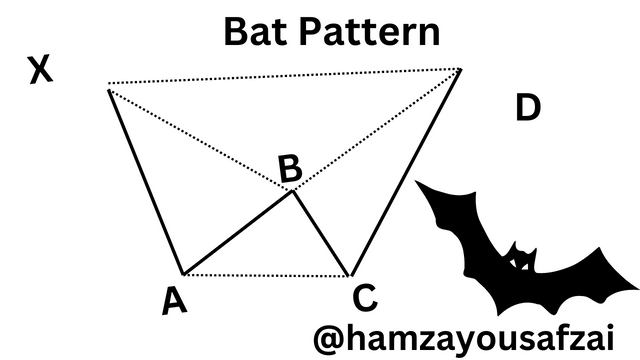
2. Bat Pattern
The Bat pattern is similar to the Gartley pattern but has diferent Fibonacci levels making it slightly more reliable for spotting reversal.
- Fibonacci Levels:
- The AB leg retraces to 38.2%–50% of the XA leg.
- The BC leg extends to 38.2%–88.6% of the AB leg.
- The CD leg retraces to 88.6% of the XA leg.
- How It Works: When the price hits the 88.6% retracement level of the XA leg I look for the price to reverse. In the Steem/USDT pair the Bat pattern can show me when the price has pulled back enough to give a strong buying or Selling opportunity.
Example: Imagine you are walking up a slope (XA) and then you step back a little (AB) take a small step forward (BC) and finally take a bigger step back (CD) before moving forward again.
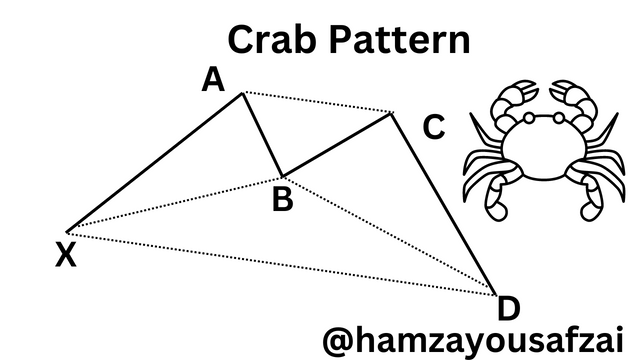
3. Crab Pattern
The Crab pattern is great for catching deeper price movements. It involve larger retracements and extensions which means it’s useful for spotting big reversal.
- Fibonacci Levels:
- The AB leg retraces to 38.2%–61.8% of the XA leg.
- The BC leg extends to 38.2%–88.6% of the AB leg.
- The CD leg extends to 161.8% of the XA leg.
- How It Works: The Crab pattern gives a clear signal when the price reaches the 161.8% extensions of the XA leg. In Steem/USDT trading if I spot this pattern I can expect a significant reversal especially during a big market move.
Example: Think of a car that rolls down hill (XA) then brakes slightly (AB) pick up speed again (BC) and zooms further down the hill (CD) before finally making a sharp U-turn back uphill.
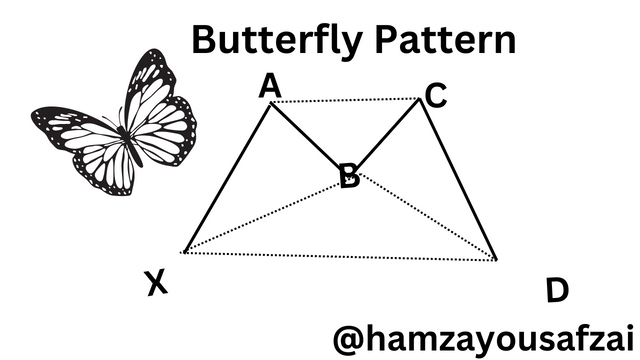
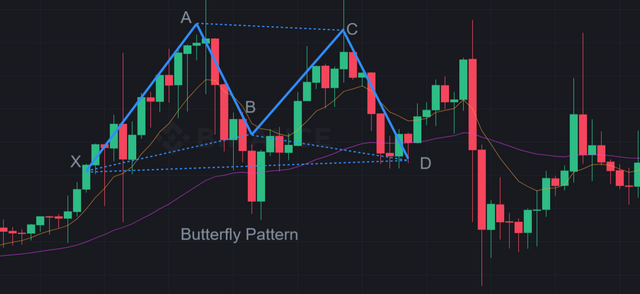
4. Butterfly Pattern
The Butterfly pattern uses extreme price movements and Fibonacci extensions which make it helpful for identifying major reversal.
- Fibonacci Levels:
- The AB leg retraces to 78.6% of the XA leg.
- The BC leg retraces to 38.2%–88.6% of the AB leg.
- The CD leg extends to 127%–161.8% of the XA leg.
- How It Works: When the price hits the 127% 161.8% extension of the XA leg I expect a sharp reversal. In the Steem/USDT market spotting the Butterfly patern tells me that a big trend is likely to reverse which is perfect opportunity to trade.
Example: Imagine running forward (XA) stopping for moment (AB) running again (BC) then dashing further than before (CD) only to realize you need to turn around and go the other way.
| Each of these harmonic patterns Gartley Bat Crab and Butterfly uses specific Fibonacci level to predict where the market is likely to reverse. By understanding these patterns I can analyze the Steem/USDT pair more effectively and identify high probability trade opportunities. whether the market is going up or down these patterns help me anticipate the next move giving me a better chance of making profitable trades. |
|---|
Identifying Harmonic Patterns in Steem/USDT Historical Price Chart Analysis and Predictions |
|---|
To identify harmonic patterns on the Steem/USDT price chart I will use common harmonic pattern like the Gartley Bat and Butterfly patterns. Harmonic paterns are formed based on specific Fibonacci ratios and they can help us predict future price movement by analyzing the completion of a patern.
Key Elements of Harmonic Patterns
Harmonic patterns are built on the idea that the price moves in wave. The main wave legs in a harmonic pattern are often referred to as X-A A-B B-C and C-D. These patterns rely on Fibonacci retracement level (e.g. 0.618 0.786 1.27 etc.) to determine potential reversal points in the markets.
Step by Step Identification of Harmonic Pattern
Lets break down the process of identifying harmonic pattern using the Steem/USDT historical price data:
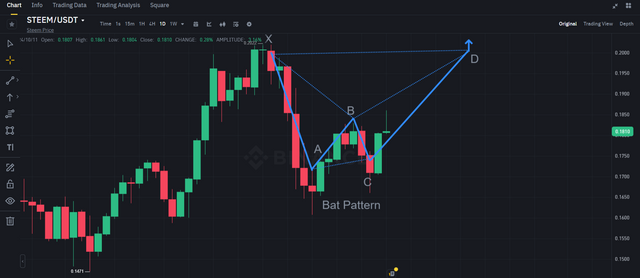
1. Gartley Pattern (Possibility)
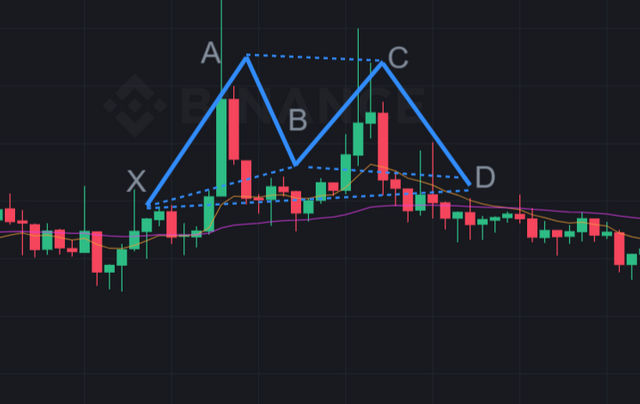
The Gartley pattern is one of the most commons harmonic patterns and it follows specific Fibonacci level. Heres how we could potentially identify it on the chart
X to A: we need to find an initial upward movement in price. From the table from 9/7/2024 (0.15628) to 9/12/2024 (0.17238) there is increase forming the X-A leg.
A to B: The next leg is retracement of the previous uptrend. From 9/12/2024 (0.17238) to 9/15/2024 (0.16489) the price retraces downwards making an A-B leg. This represents around a 61.8% retracement from X-A fiting the Gartley pattern criteria.
B to C: This leg is an up ward retracement. From 9/15/2024 (0.16489) to 9/20/2024 (0.18699) the price rises again completing the B-C leg. This aligns well with the Fibonacci range of around 0.382 to 0.886 retracement of the A-B leg which is common for harmonic pattern.
C to D: The final leg is a downward movement. From 9/20/2024 (0.18699) to 9/27/2024 (0.20099) the price move downwards completing the C-D leg. The expected D-point of Gartley pattern is typically 0.786 retracement of the X-A move.
.png)
2. Fibonacci Levels for Prediction
- X-A Leg: From 0.15628 to 0.17238 (Initial rise)
- A-B Leg: From 0.17238 to 0.16489 (Downward retracement close to 61.8%)
- B-C Leg: From 0.16489 to 0.18699 (Upward retracement)
- C-D Leg: From 0.18699 to 0.20099
Once the D-point is reached traders expect reversal either upward or downward depending on the pattern. In the case of the Gartley pattern identified here the completions of the D-leg could signal an upward move in the price after the D-point indicating a bullish reversal.
Potential Price Movements
- Based on the completion of this Gartley patern the price could potentially reverse upwards after reaching the D-point around 0.20099. This is the key level to watch for a reversal.
Example:
Imagine the price of a stock moved from $10 to $20 then retraced to $16 then rose again to $19 before finally falling back to $18. This is how harmonic patterns often play out following these zig zag movements and Fibonacci levels. In the case of Steem/USDT the price behaves similarly following specific ratio that form these harmonic wave.
| By analyzing the price movements and the Fibonacci ratios we have identified a potential Gartley harmonic pattern on the Steem/USDT chart. Based on this pattern once the D point completes around 0.20099 there is a possibility of a bullish price reversal. Traders often use such patterns to enter the market at the D-point and ride the next upward wave anticipating higher prices. |
|---|
Using Fibonacci Levels in Harmonic Pattern Analysis: Predicting Steem Market Reversals |
|---|
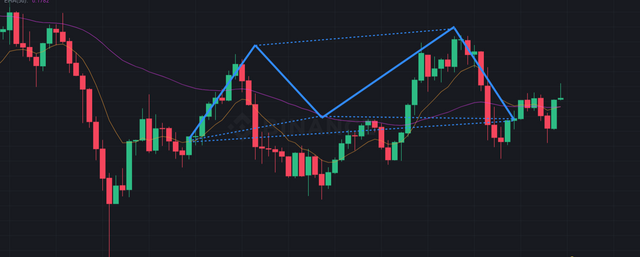
Fibonacci retracement and extension levels play a crucial role in identifying harmonic patterns because these pattern rely heavily on specific Fibonacci ratios to Predict potential reversal zones. Here how Fibonacci is applied to harmonic pattern and how it can help in forecasting price movements in the Steem market:
Fibonacci Retracement and Extension in Harmonic Patterns
Harmonic patterns like the Gartley Bat Crab and Butterfly all involve different Fibonacci level to form their structure. Fibonacci retracement levels such 0.618 or 0.786 help identify key area where price pull back might occur. Fibonacci extension levels such 1.272 or 1.618 indicate Where the price may extend to often signaling the end of a pattern and the potential reversal zone.
Applying Fibonacci to a Harmonic Pattern in Steem/USDT
Lets say we are analyzing a historical Steem/USDT chart where Bullish Gartley pattern is identify. Here how the Fibonacci levels work with this Pattern:
- Point X to A: You identify the first leg where the price moves from Point X to Point A. This forms the first trend direction.
- Point A to B: The retracement from Point A to Point B typically falls around the 61.8% Fibonacci level signifying a pullback in the market.
- Point B to C: The price then retraces again this time to around the 38.2% to 88.6% Fibonacci level signaling another phase in the pattern.
- Point C to D: The final leg of the pattern extends from Point C to Point D typicaly aligning with the 127.2% or 161.8% Fibonacci extension level. This level become the potential reversal zone where traders look for change in trend.
.png)
Example of a Steem/USDT Harmonic Pattern Prediction
Imagine a Bullish Gartley pattern has formed on a Steem/USDT chart. As price reaches Point D at the 127.2% Fibonacci extension level trader might anticipate a reversal in price direction. The price after completing the pattern start to rise again confirming the validity of the harmonic pattern.
In this way Fibonacci retracement and extension level help in both identifying harmonic patterns and predicting price reversals allowing traders to enter positions with more confidence.
By using these tools effectively I have been able to analyze and predict potential turning points in the Steem market. The proper application of Fibonacci level within harmonic patterns can be a powerful tool for trading succes.
Trading Strategy for the Steem Token Using Harmonic Patterns |
|---|
I have found harmonic patterns to be powerful tool for identifying potential reversal point in the markets. In this guide I will outline my step by step trading strategy for the Steem token using these pattern detailing my entry and exit point and how I manage risk throughout the trade.
Step 1: Understanding Harmonic Patterns
Harmonic patterns are unique price formation that reflect specific sequence of movements. The most common patterns I focus on include:
- Gartley
- Bat
- Butterfly
- Crab
Each of these patterns has specific Fibonacci retracement and extension levels that help define their structure. I have spent time familiarizing my self with these patterns ensuring I can recognize them efectively before applying them to my trading strategy.
Step 2: Identifying the Pattern
Chart Setup: I start by setting up my chart on TradingView which I find useful for technical analysis. I prefer using candle stick chart because they provide clearer view of price movement.
Timeframe Selection: Depending on my trading style I choose appropriate time frame . For swing trading I often look 1 hour or 4 hour charts while for day trading I use 15 minutes or 30 minute chart.
Pattern Recognition: I keep an eye out for harmonic patterns forming on the chart. For instance when I spot Gartley pattern I ensure it meets the required Fibonacci ratios
- The retracement from point X to points A shoulds be 61.8% of the XA Leg.
- The retracement from point A to points B shoulds be 38.2% or 88.6%.
- The retracement from point B to points C shoulds be 38.2% or 88.6%.
- The retracement from Point C to points D should be 78.6% of the XA leg.
.png)
Step 3: Entry Points
Once I identify a valid harmonic pattern I determine my entry points:
Confirming the Pattern Completion: I wait for the price to reach point D signaling the completion of the harmonic pattern.
Setting Entry Orders: I place a buy limit order slightly above the point D price. This strategy ensures I enter the trade as soon as the price confirms the patern.
Step 4: Exit Points
Establishing exit points is vital for realizing my profits:
Setting Profit Targets: I use Fibonacci extension levels to set my profit target. For a Gartley pattern I typicaly set my profit targets at the 61.8% and 78.6% extensions of the XA leg. For example if my entry price is at point D my first target would be at the price that reflects the 61.8% extension.
Using a Trailing Stop Loss: I consider implementing trailing stop loss to lock in profits as the price moves in my favor. This aproach allows me to exit the trade if the price reverses while still capturing some gains.
Step 5: Risk Management
Risk management is a critical part of my trading strategy:
Determining Position Size: Before entering trade I decide how much of my capital I’m willing to risk. I follow a common rule of risking no more than 1-2% of my total capital on a single trade. For example if my account balance is $1 000 I will risk between $10 and $20 per trade.
Setting Stop Loss Orders: I place a stop-loss order below the last swing low (for a buy trade) or above the last swing high (for a sell trade). This step is crucial in limiting my losses if the trade goes against me.
Reviewing and Adjusting: After entering the trade I continually asses market conditions. If new data or patterns suggest change in direction I am prepared to adjust my stop-loss or exit the trade early.
| Using harmonic patterns to trade the Steem token has become an essential part of my trading approach. By following the steps outlined above I can enhance my chances of identifying profitable trading opportunitie while effectively protecting my capital. I believe that continuous education and adaptability are key to success in trading. |
|---|
Current Market Analysis Using Harmonic Patterns |
|---|
As of October 11 2024 the price of Steem is currently at $0.18076 reflecting 5.90% increase from the previous day’s close of $0.17069. The recent price movement show some volatility with a notable range of price fluctuations over the past few week.
To analyze potential future price movements I will employ harmonic patterns which are technical analysis tools use to identify potential reversals in price trends based on Fibonacci ratios.
Harmonic Patterns Observed
Bat Pattern: This pattern typically indicates a bullish reversal and can be identifie in the recent price action. The recent price dropped from $0.19652 on September 29 to $0.17069 on October 10 and now we’re seeing a recovery. If the Current price respects the harmonic levels Bat pattern could be forming which suggests a potential upward movement to approximately $0.200.
Gartley Pattern: The Gartley pattern is another bullish reversal pattern that appear to be in play after the recent downtrend. The initial leg (XA) from $0.19652 to $0.17069 could suggest a retracement back to the $0.190 - $0.195 range aligning with the expected resistance level.
Potential for an ABCD Pattern: Given the recent data an ABCD pattern may form the price moves up to $0.190 and then down to a support level near $0.175 which could provide an entry point for traders looking for long position.
.png)
Trading Decisions Influenced by Harmonic Patterns
Based on the harmonic patterns identified my trading decisions will focus on the following:
Buy Signal: If the price breaks above $0.182 and continues towards the $0.190 target it may confirm the bullish pattern and signal a buying opportunity. This aligns with the expectation of a potential reversal supported by the pattern observed.
Stop Loss Levels: I will set stop loss orders slightly below key support level (e.g. $0.170) to manage risk in case the bullish scenarios do not materialize and the price declines.
Profit Taking Strategy: Given the anticipated resistance levels at $0.190 and $0.200 I will plan to take partial profit at these levels to lock in gains as the price approaches expected resistance based on the harmonic analysis.
| The current market analysis using harmonic patterns indicates potential bullish reversals for steem providing oportunities for trading decisions based on identified patterns. By closely monitoring the price movement and applying these patterns to my trading strategy I aim to enhance the accuracy of my predictions and improve my trading outcome in the coming weeks. |
|---|
Upvoted. Thank You for sending some of your rewards to @null. It will make Steem stronger.
Hi, @hamzayousafzai,
Your post has been manually curated!
thank you so much
This post has been upvoted/supported by Team 5 via @httr4life. Our team supports content that adds to the community.
Dear friend you have shown amazing talent as always the patterns you have presented with pictures of butterfly bats and crabs are really visual and functional good luck friend
thank you so much for your feedback
Dear @hamzayousafzai bro..
It is a rich post which can be very helpful not only for new traders but also for experienced traders. Important tips on stop loss and risk management are especially valuable.
So good luck for the contest.
Thank so much for your encouragement