Crypto Academy Season 6 week 1: Crypto Trading Using Zig Zag Indicator
The price trend is a very important element in trading. Whether trailing or waiting for a reversal, almost all traders will pay close attention to price action; whether up, down or just sideways. Various indicators and analytical techniques have been developed to identify or even predict trend changes at an early stage. But unfortunately, not all solutions bring the expected results.
Well, the Zigzag indicator is a technical tool specially designed to identify changes in price trends. What is marked is not just any trend, as this indicator only generates a signal when a major trend changes.
Also the ZigZag indicator shows significant extremes and is used in many trading systems and as an integral part of expert advisors. Let's see how ZigZag can be useful for traders and in which trading strategies it is used.
The indicator works according to a simple scheme - it determines local minima and maxima on the chart and connects them with lines. Small movements and market noise are ignored. Thanks to this, the trader sees a clear picture of the price movement, free from distractions and minor factors. Effective on all assets and all periods.
The algorithm looks like a broken line superimposed on the price. Hence its name was coined. Unlike other popular tools, ZigZag only reflects past movements and does not predict trend changes. Thus, the zigzag indicator does not give signals to open a position, so it is not used in its pure form for trading. But as an integral part of a chart analysis strategy, the Zigzag indicator is extremely useful.
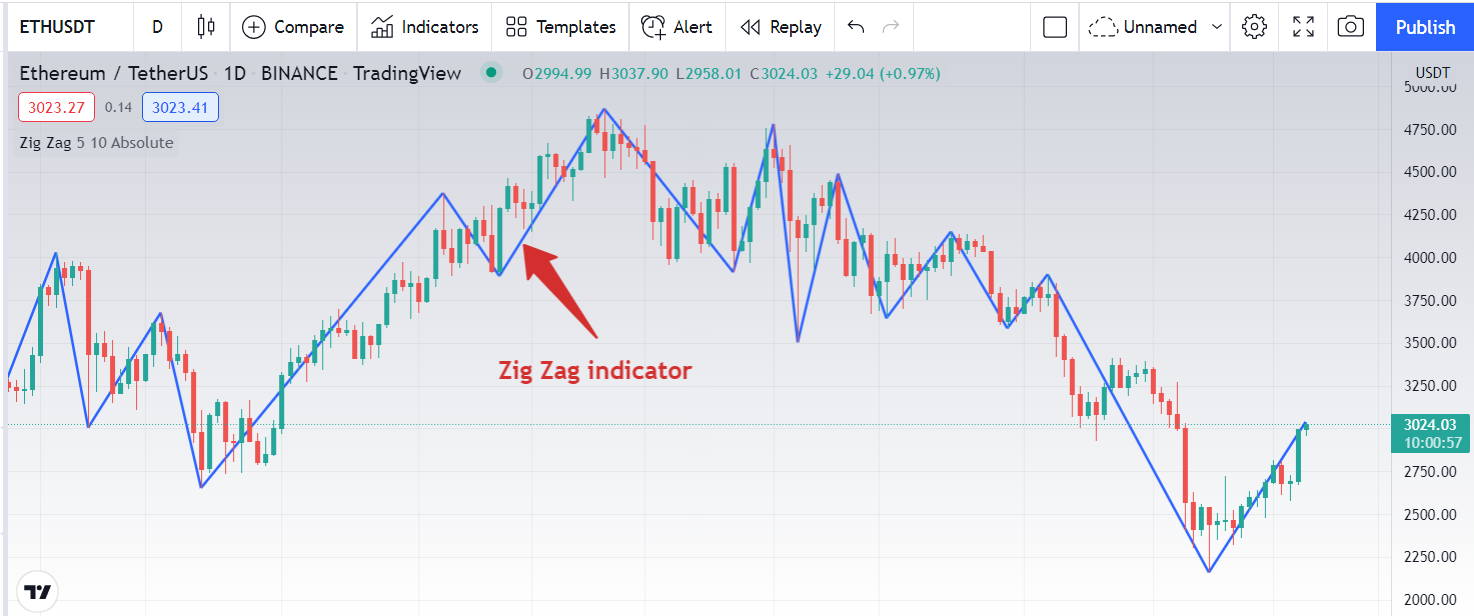
We can immediately see a concrete example of the ZigZag trading indicator thanks to this image taken from the TradingView...
ZigZag works according to the following algorithm:
-Finds the lowest price in the depth interval;
-If the trend is moving down, the line moves when it exceeds the deviation distance. There is therefore a redesign when modifying the settings of this parameter;
- If the trend goes up, the program starts looking for a maximum in the depth range;
-If the price rises further, the line moves when the deviation interval is overcome and is drawn again; - The cycle repeats.
Depending on the type of chart on which it is applied, ZigZag trading takes into account different values.
Indeed, in the "line chart" it takes as reference the closing prices (because these are the only ones that this type of chart adopts) while in a candlestick or a bar chart, the Zig Zag calculation refers to the minimum prices and max.
Second, it must be said that since the Zig Zag focuses on historical price data, the last point (and therefore the last segment of the segment) is always constantly changing, since the next price could move it again.
This means that the last point should not be taken into consideration in the analyzes (since it is still being worked out), but should be based only on what happened before.
On the TradingView platform, the Zig-zag indicator can usually be customized with the definition of two parameters:
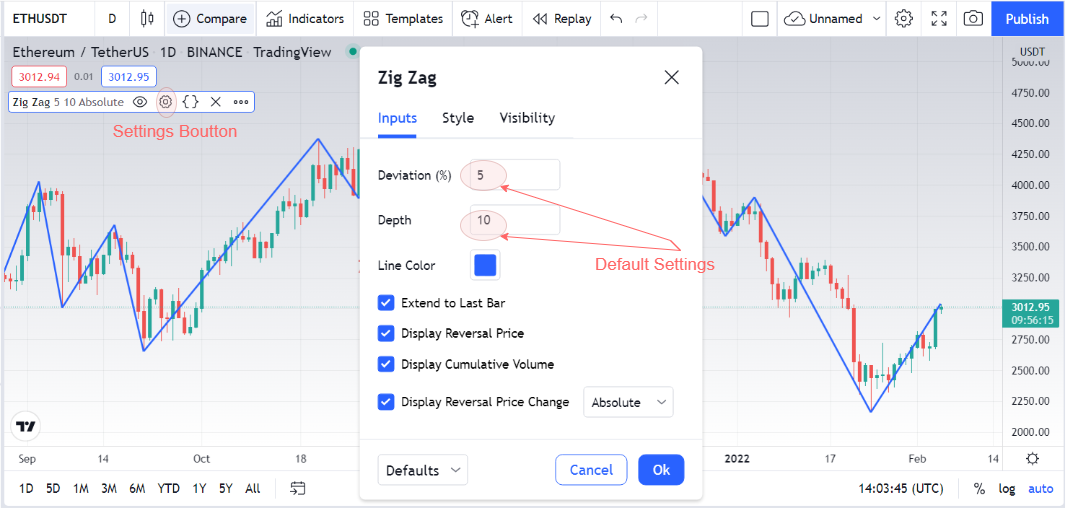
Depth: it is the minimum distance (in candles) in which the indicator will not represent a new maximum/minimum that differs from the previous one by a value at least equal to the "Deviation". It is usually set to 10.
Deviation: Deviation is the minimum price change that must have a maximum/minimum from the previous maximum/minimum for the ZigZag to identify a new peak. It usually expresses a percentage and is fixed at 5.
Traders usually customize the indicator by acting only on the "depth" parameter. But be careful, because if you set a value too low it could give a much more "hysterical" ZigZag trend, which would generate short and numerous breaks (in practice, many unreliable microtrends and continuous reversals).
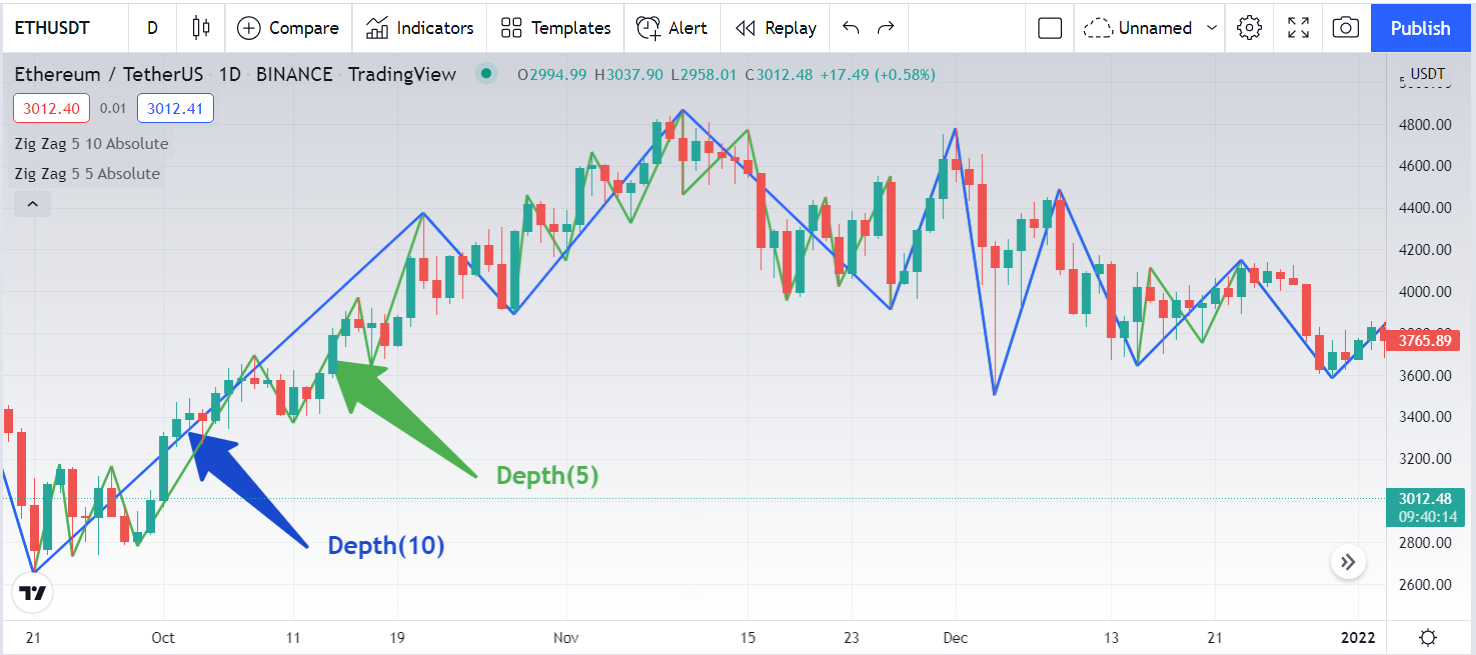
On the contrary, if we use thresholds that are too high, the Zig Zag will become too "insensitive" because it will eliminate not only background noise but also the most useful data.
To properly set this parameter, the only way is to study the market conditions and the specific asset that is being technically analyzed.
By way of example, we can see thanks to the TradingView platform how the Zig Zag varies when we use a depth equal to 10 (in blue) and a depth equal to 5 (in green).
Professional traders use ZigZag mainly to determine the trend (price trend) of the market. Specifically, on the price chart, if you see ZigZag making peaks and troughs in ascending order, then the price is in an uptrend. Also, when the ZigZag peaks and troughs are created in descending order, the price is in a downtrend.
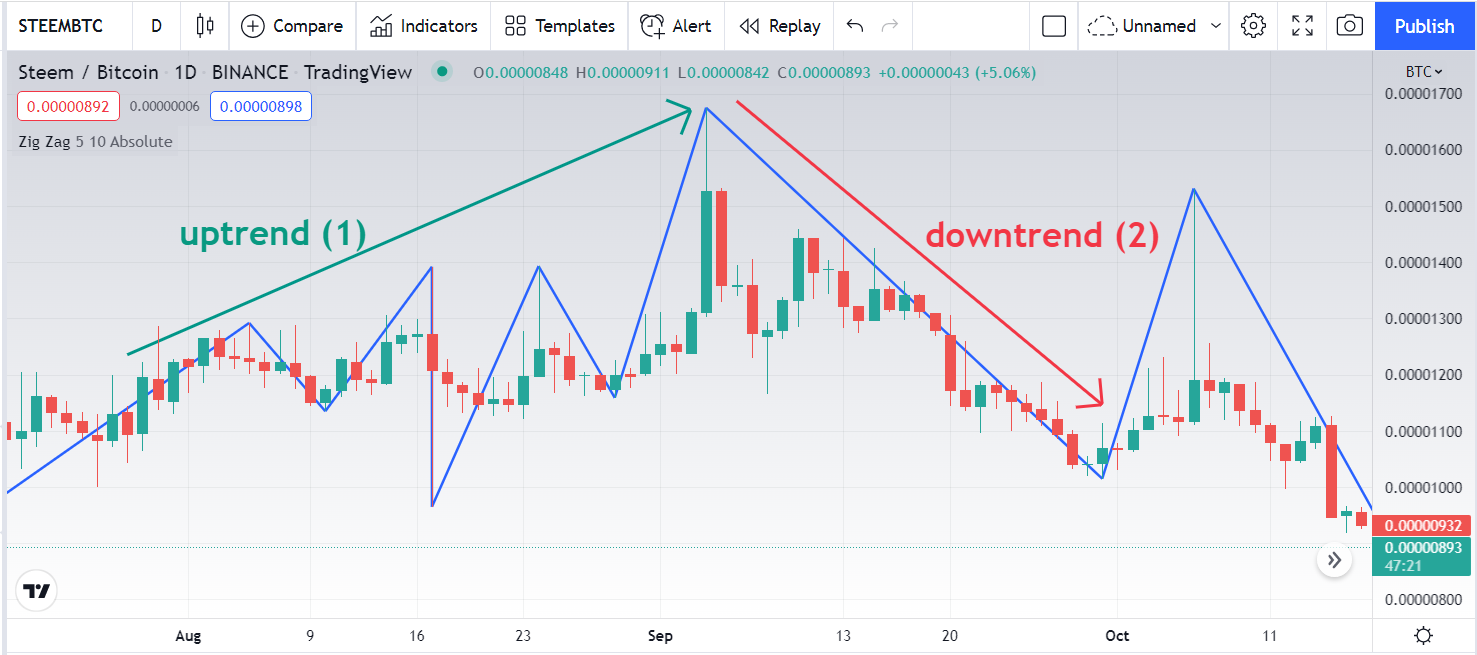
(1) The next peak is higher than the previous ones + the next low is higher than the previous ones => The trend is up (ZigZag is up).
(2) Next low is lower than previous low + Next high is lower than previous low => Downtrend (Zig Zag is down).
Execute a buy order in an uptrend when price makes the next low higher than the previous low, the Stop Loss is below the nearest low.
Execute a sell order in a downtrend when price makes the next high lower than the previous one, the stop loss is above the nearest high.
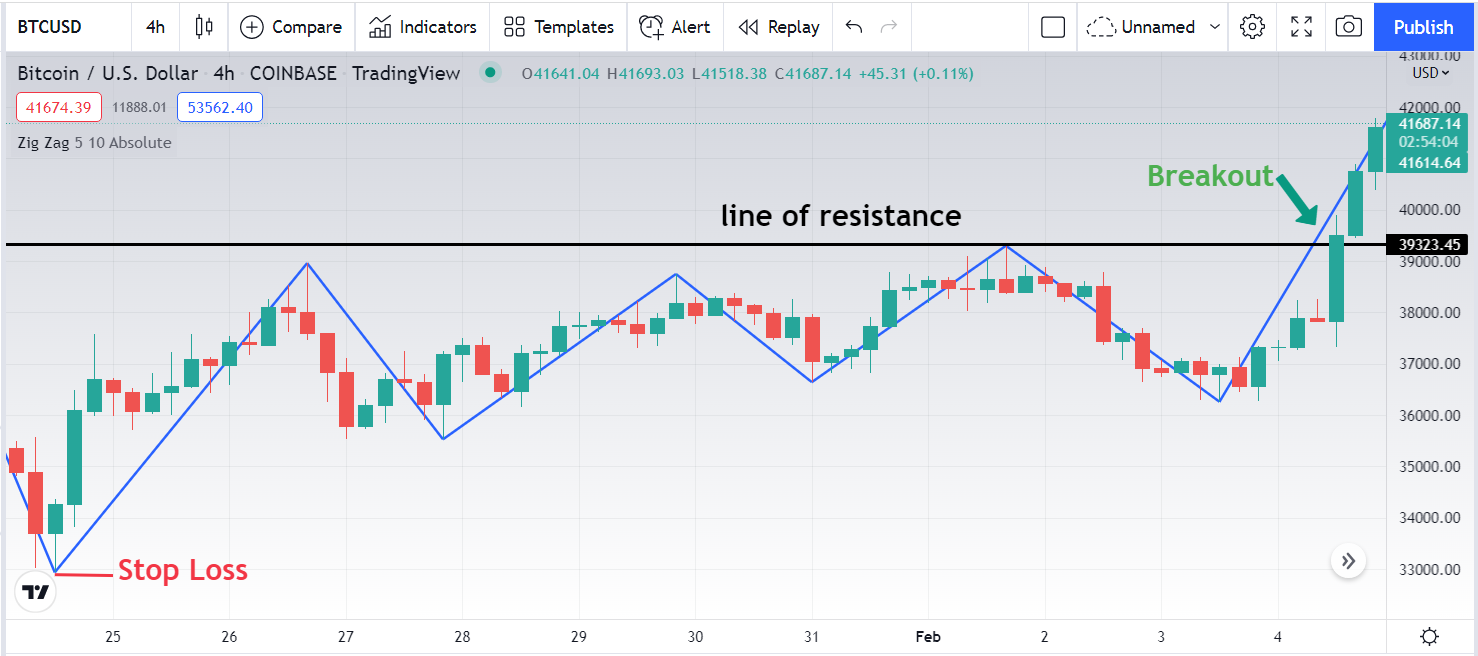
You can refer to how to trade with ZigZag in an uptrend as in the example below:
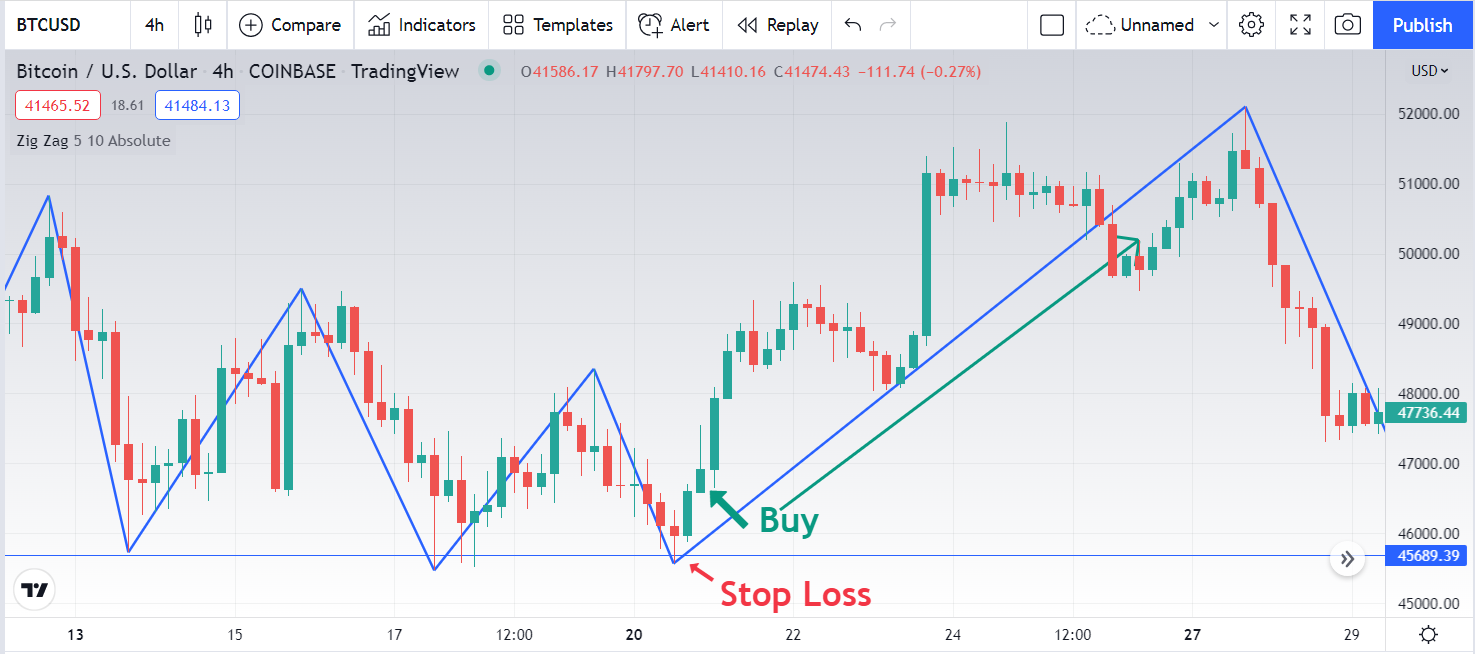
As you can see at the time of execution of the buy order, the price is in an uptrend when creating the next high above the previous high and the next low above the previous low.
We execute the buy order as shown in the image and place the Stop Loss point below the nearest low according to the Zigzag indicator.
Another use of ZigZag that you can apply is to identify resistance areas (Resistance/Support) of price. Where the set of ZigZag horizontal highs will be the resistance zone and the set of ZigZag horizontal lows will be the support zone.
Take a look at the sample chart below:
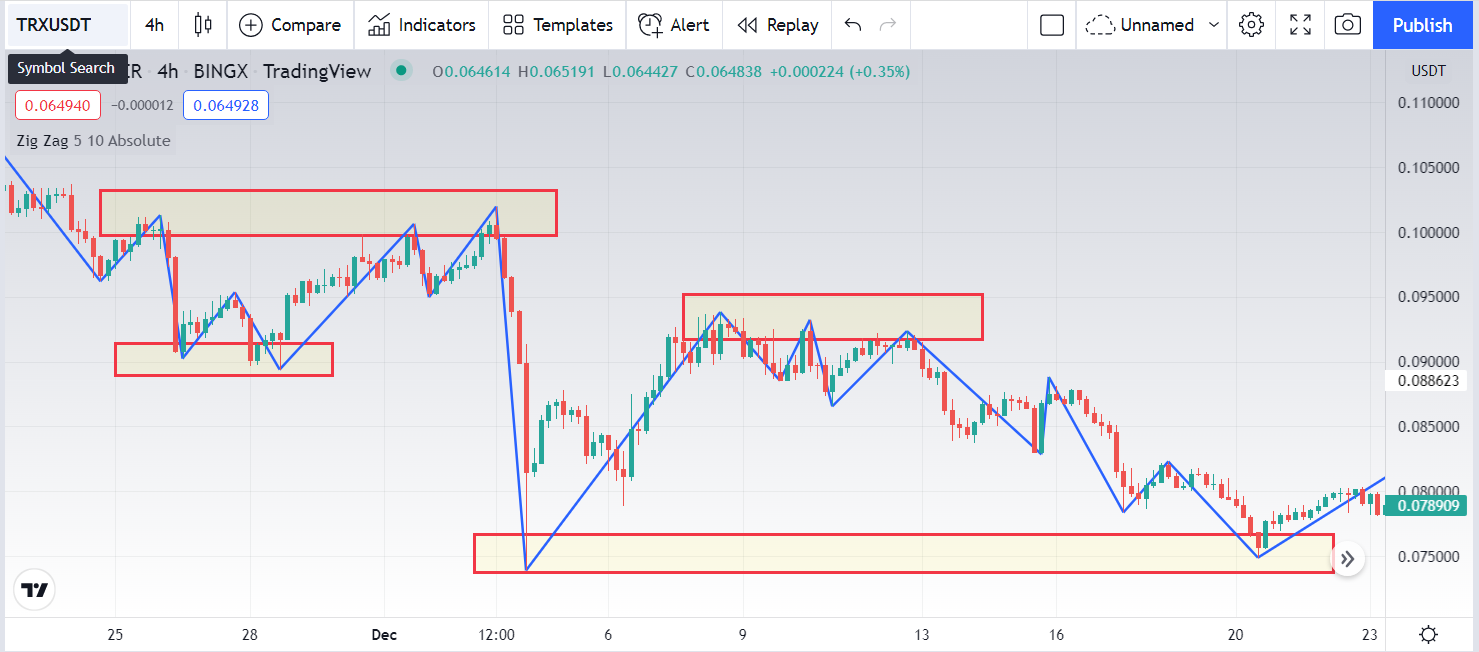
In the chart, the price zones are marked with red rectangles. These are the price areas that when the Zigzag indicator approaches, it tends to turn around.
This gives us potential areas of support and resistance. Then, the Zigzag indicator can provide a prediction about the future; because you can see prices rotating multiple times in one area. And from there it is possible to test the strength and weakness of a support and resistance level.
One of the best zigzag strategies is to wait for candlestick patterns to appear in these price areas.
Although not a perfect zigzag strategy, it will give you an idea of the likelihood of the candlestick pattern forming in your favor.
Many trading strategies are built around the idea of trying to capture and follow a short-term trend. However, there are times when it is more profitable to trade against the tide.
But trading is not for traders new to the market. Because for new traders, they don't have enough knowledge to avoid market pitfalls.
Depending on the market structure, the price will often have a pullback zone, traders can trade short term to capture the price change during this period.
This is the reason why the Zigzag indicator is often used in Elliott Wave trading.
According to Ralph Nelson Elliott - who researched and developed the Elliott wave theory, the market is made up of two phases - the impulse wave and the corrective wave.
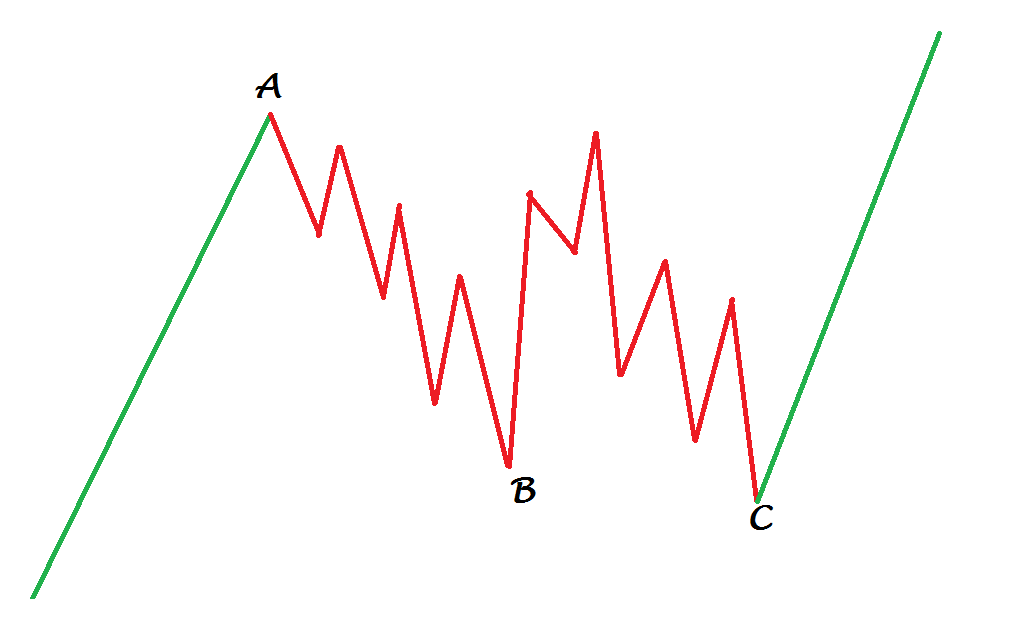
Elliott believes these moves are driven by market sentiment. The biggest challenge with Elliott Waves is figuring out where the wave starts and ends.
At this point, the zigzag indicator can help you completely. The Zig Zag indicator is often used in conjunction with Elliot Wave Theory to determine the position of each wave in the overall cycle. The zigzag indicator can help you identify the zigzag pattern in the overall correction.
The ZigZag is a valid indicator for trading by exploiting the breakout, or the breakout of supports and resistances that are traced from the same peaks of the ZigZag. This also applies to intraday trading on reduced Timeframes (eg from 15 minutes to 1 hour).
We emphasize that on intraday, our suggestion is to ALWAYS go in the direction of the main trend (medium/long term), never against it.
Before proceeding, let's make an important clarification: now, we show you how the ZigZag can be useful to us, but just to simplify, we will use it alone. In fact, it should always be used with other tools, so much so that in a moment we will also see it in combination with the CCI (Commodity Channel Index).
Basically there is a way to take advantage of the Zig Zag with a standard setting of 10,5, ie by drawing lines from the crest points which will act as supports/resistances.
Therefore, when a breakout of these levels occurs, we have a market entry signal.
Here is an example still taking advantage of TradingView:
In these cases, the stop-loss can be placed at the opposite top (or if it is too wide, we can place it in the middle) while the profit between half and 2/3 of the length of the broken line of our ZigZag Line.
This is the basis for using the ZigZag, which should always be used with other tools.
For this, in the next paragraph we will see another example, using it in combination with the CCI (Commmodity Channel Index) .
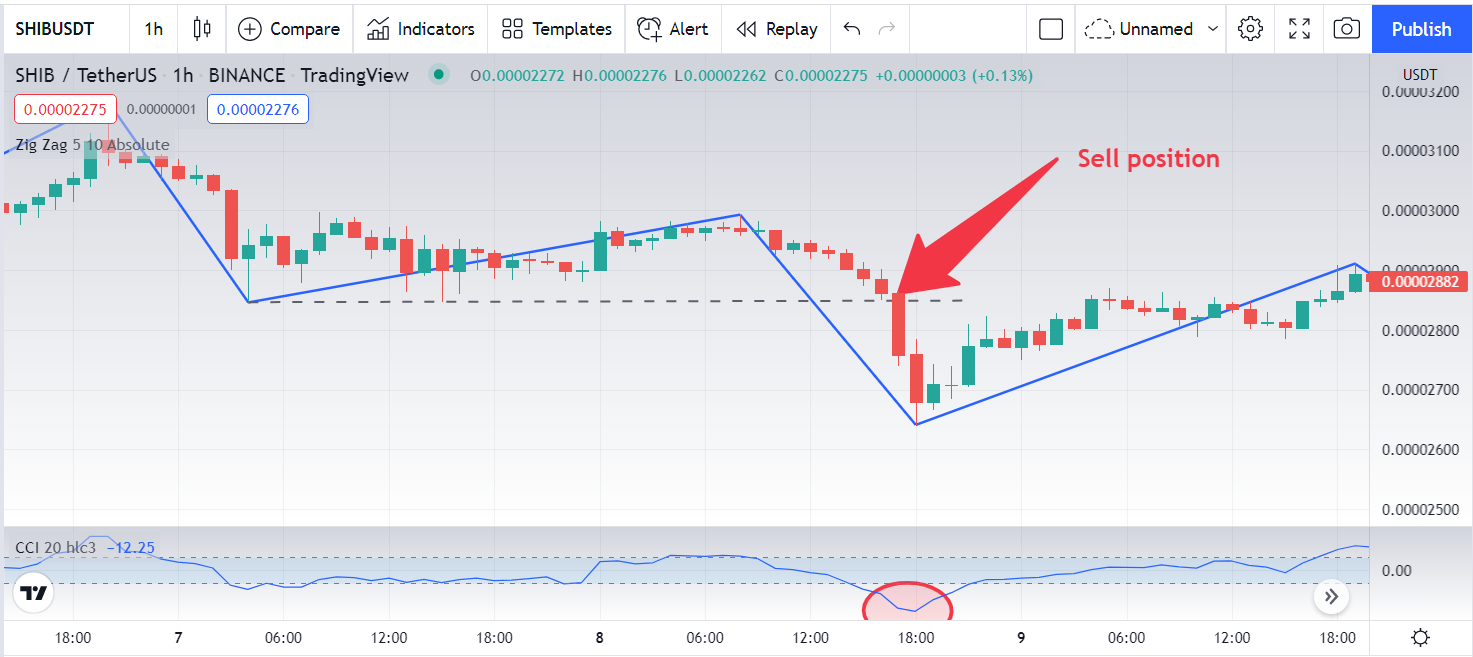
In this case we use the ZigZag indicator (values 10,5) as we saw a short time ago, but with the CCI (Commmodity Channel Index) which is an indicator that makes us understand if there is has tension on the buyers' or sellers' side.
On our Markets.com platform we receive a BUY SIGNAL when there is a breakout of the last maximum value of the zigzag and at the same time the value of the CCI exceeds 100. The entry value is that of a breakout of a point of the extreme value of the Zigzag.
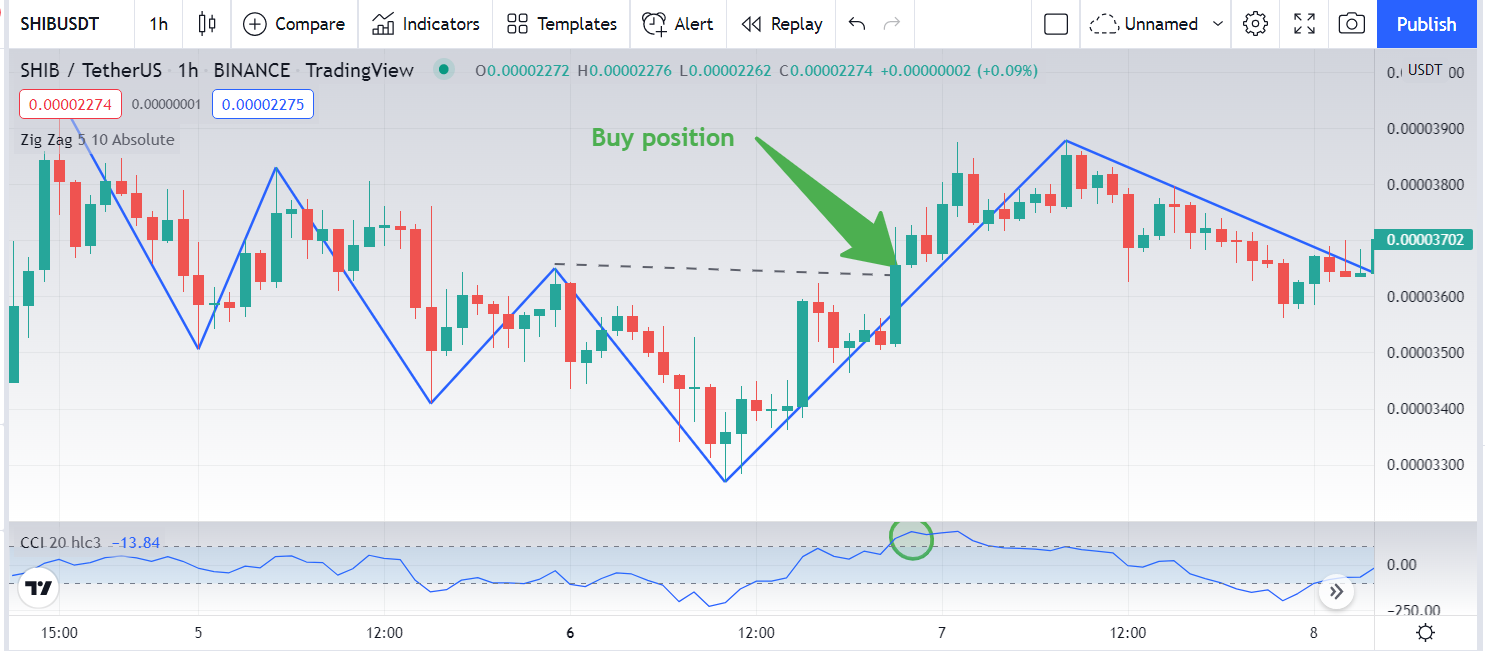
Instead, we receive a SELL SIGNAL when there is a break in the last minimum value of the zigzag and at the same time the CCI value will be below -100. The entry value is that of breaking a point of the extreme value of the Zigzag.
Another combination that traders cannot ignore is the combination of the zigzag tool with the Fibonacci retracement tool.Fibonacci retracement
In the example chart STEEM/BTC H4 frame below; The Fibonacci retracement is drawn to coincide with a line of the Zigzag indicator.
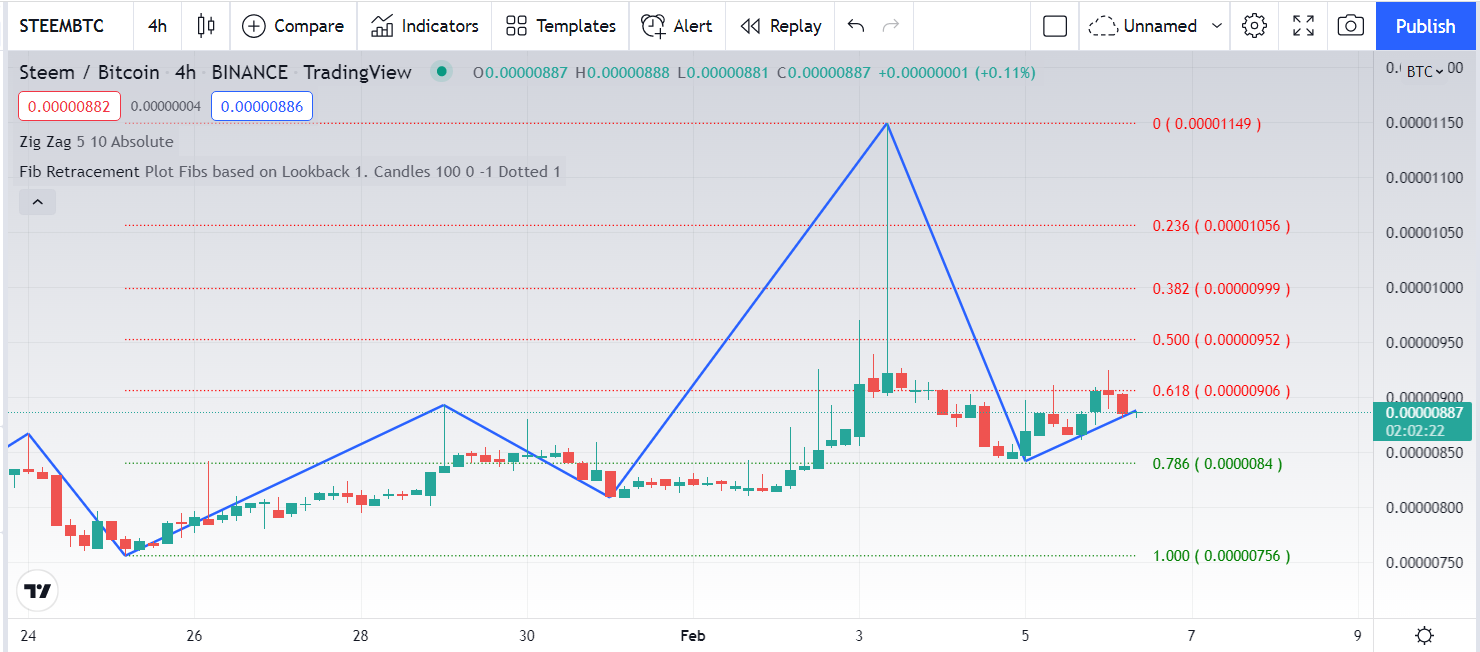
Often the ZigZag is used with Fibonacci Retracements Fibonacci Retracements, in order to take advantage of any fluctuations that occur during market phases with well-defined trends, which take their typical retracement breaks.
Operationally, the Fibonacci is drawn using a maximum/minimum peak of a ZigZag as the origin and the opposite peak of the same ZigZag as the term. Then for market entries and exits, Fibonacci retracement trading techniques are used, so the "rebounds" in the price between the different retracement levels.
Pros:
This indicator helps to analyze the price movement with a given amplitude and shows the trend lines that connect the main depressions and peaks of the chart. Thanks to the fact that ZigZag shows only the most important revolutions and other price change trends, it quickly facilitates chart analysis. Let's take a look at the benefits of using this indicator:
- Ability to analyze the most significant trends without market noise;
- Ability to work at different time intervals;
- Combined work with various instruments of technical analysis;
- Efficient work with Eliot waves or Fibonacci levels.
Cons:
When working with Zigzag, it is important to keep in mind that its last line can change (repaint) according to price changes. Accordingly, this is why ZigZag should only be used to analyze past price movements. Here are the main disadvantages of the indicator:
- The complexity of forming an objective prediction (some traders interpret the same phenomenon differently);
- With the standard version of the indicator, the last section is often redrawn.
The indicator is most useful when trading at high timeframes, so it is best to use long-term trading systems. Otherwise, the probability of loss-making transactions increases.
The ZigZag Indicator does not have the ability to predict the current price movement and draw lines based only on the actual price. If you agree with strategies where ZigZag is used to look for trade openings (signals), keep in mind that this is fundamentally at odds with the purposes of ZigZag and is not intended to do so.
This indicator, as we have seen above, does many other useful things: it shows the formation of a new Eliot wave, works well with Fibo levels, identifies the price trend, chart shapes and harmonious. With its help, market noise can be filtered out and premature market entry can be avoided. Therefore, in trend trading strategies, ZigZag is a very useful tool to define the trend itself. It is more appropriate to apply the indicator to longer timeframes, starting with H1 and up.
1. Show your understanding of the Zig Zag as a trading indicator and how it is calculated?
2. What are the main parameters of the Zig Zag indicator and How to configure them and is it advisable to change its default settings? (Screenshot required)
3. Based on the use of the Zig Zag indicator, how can one predict whether the trend will be bullish or bearish and determinate the buy/sell points (screenshot required)
4. Explain how the Zig Zag indicator is also used to understand support/resistance levels, by analyzing its different movements.(screenshot required)
5. How can we determine different points using Zig Zag and CCI indicators in Intraday Trading Strategy? Explain this based on a clear examples. (Screenshot required))
6. Is there a need to pair another indicator to make this indicator work better as a filter and help get rid of false signals? Give more than one example (indicator) to support your answer. (screenshot required)
7. List the advantages and disadvantages of the Zig Zag indicator:
8. Conclusion:
Try to read the lesson and the assignments carefully before you start editing.
You must write an essay that contains at least 600 words.
Make sure that you post your homework into the SteemitCryptoAcademy community, and your homework title format like this "[Title]- Crypto Academy /S6W1-Homework Post for kouba01
Please do not add the tag #club5050 if you do not interpolate all the conditions to participate in this initiative.
Use copyright-free images with mention of its source, if possible, produce your own.
Plagiarism is forbidden in Steemit Crypto Academy, and its perpetrators may face serious penalties.
This homework assignment will run until 12th February'2022, Time- 11:59 PM UTC.
Include in your post among the first five hashtags #kouba-s6week1 and #cryptoacademy.
Users who are powering down will not be voted and considered excluded from participation.
Additionally, users with a reputation below 60 and/or haven't at least 250 SP in their wallet won't benefit from voting for their homework.


Cc:-
@steemitblog
@steemcurator01
@steemcurator02
Congratulations @kouba01
This is the most positive post amongst

top 100hot posts on steemit at this moment.Wow. It's really long but it was worth reading. Zig zag indicator is good,It's definitely a powerful tool and I think it can be tweaked to predict future trend change
No more 150 SP power up is required? Or may it be I missed something, Professor?
See the last update on Steemit Blog. It's not needed anymore by now.
yes tahnks.
y Es por este tipo de cosas que HIVE.blog cada día tiene mas usuarios. que pasión por hacer que estas tareas sean una tortura.
Pues yo no creo que en hive vea este tipo de contenido de calidad que es realmente valiosa para quien necesite aprender y beneficiarse de tales conocimientos que dudo mucho se encuentren con facilidad en alguna otra parte. Mi humilde opinión
Интересный индикатор ZigZag! Спасибо за подробный пост!
Thank you.
Thanks so much for sharing this post
Sir kindly let me know that I am eligible to participate.
Sorry you can't participate.
Greetings professor.
Now am i eligible to participate in cryptoacdemy contest?
Hello, Professor
Here is my submission. I don't know why my homework is unable to find through the tag though I use the correct tags. That's why I attached my homework on this comment.
https://steemit.com/hive-108451/@masumrbd/crypto-trading-using-zig-zag-indicator-crypto-academy-s6w1-homework-post-for-kouba01
Thanks.
@kouba01 if you are not qualified for club5050 yet can’t you partake in the homework task ???
You have to buy some Steem and balance towards the club if you want to send a task this week. Regards.
What if I wait till a month time where my withdrawal and powerup is 0:0
I understand you can power up any amount from 1 Steem or more within the previous last 30 days if you didn't cash out a value that is superior of the half of your earnings. In your case if you didn't cash out or power up nothing of nothing during last two or three months, you can even join club 75 or club 💯 respectively. #venezuela #affable
Dear professor. How can I find CCI you used in lesson? In Trading View in just seeing scripts with other names, or is it just me? Thanks in advance.
Thank you. It was displayed in a Spanish name translation. That is why I couldn't find it. ☺️
https://steemit.com/hive-108451/@ahumadaliliana29/crypto-trading-using-zig-zag-indicator-crypto-academy-s6w1-homework-post-for-kouba01