Trading Steem with Harmonic Patterns.
Hello Everyone
This is @max-pro from, #Bangladesh
 Thumbnail made by Canva
Assalamu Alaikum friends. Hope you all are well. By the grace of Allah I am also well. As the last entry of this week, I came to participate in the engagement contest organized by this community. Today's topic is Trading Steem with Harmonic Patterns. So this is a great topic, thanks to all of the community. So there are a few questions mentioned which I will try to put simply. So let's begin.
| Question 1: Explain the Key Harmonic Patterns. (Describe the four major harmonic patterns: Gartley, Bat, Crab, and Butterfly. Discuss their specific Fibonacci levels and how each pattern can be used to identify potential reversal zones in the Steem/USDT pair.) |
|---|
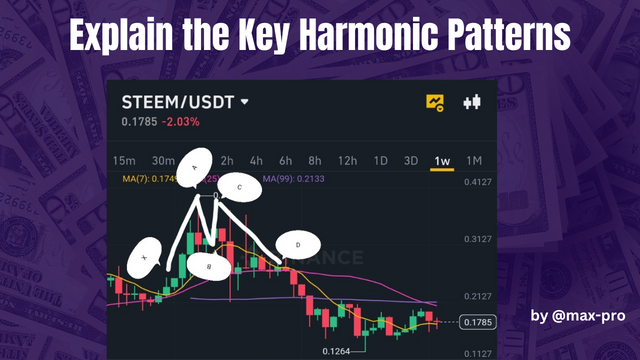
Explain the Key Harmonic Patterns : There are basically four main harmonic patterns. These are Gartley, Bat, Crab and Butterfly. So each of these patterns have specific Fibonacci levels that help indicate potential reversal zones in the market. These patterns usually signal trend reversals and are calculated using the Fibonacci ratio. That's the point. Below I have shown them as detailed examples.
 made by Canva
Gartley Pattern: As far as I know Gartley pattern is a popular harmonic pattern which basically consists of a strong trend followed by a correction. This pattern usually starts at the 61.8% retracement and ends at the D point. Where point D can be a potential reversal zone.
Bat Pattern: In my opinion the bat pattern shows a 38.2%-50% Fibonacci retracement from point X-A to point B. This pattern completes at point D at the 88.6% Fibonacci level which is an important reversal level.
Crab Pattern: The crab pattern is considered a highly extended harmonic pattern. Where the B point is positioned at a 38.2%-61.8% retracement of the X-A point. The D point reaches the 161.8% Fibonacci extension and indicates a possible reversal zone.
Butterfly Pattern: Point B of the butterfly pattern is located at 78.6% retracement of X-A and point D marks 127.2% Fibonacci extension. This is a possible indicator of a very strong reversal. So each pattern determines points through specific Fibonacci levels and predicts potential reversals. For example, a market reversal can be identified in the STEEM/USDT pair.
| Question 2: Identifying Harmonic Patterns on a Steem Chart. (Using a historical price chart of Steem/USDT, identify one or more harmonic patterns that have formed. Explain how the pattern adheres to the Fibonacci ratios and predict the potential price movements based on the pattern's completion.) |
|---|
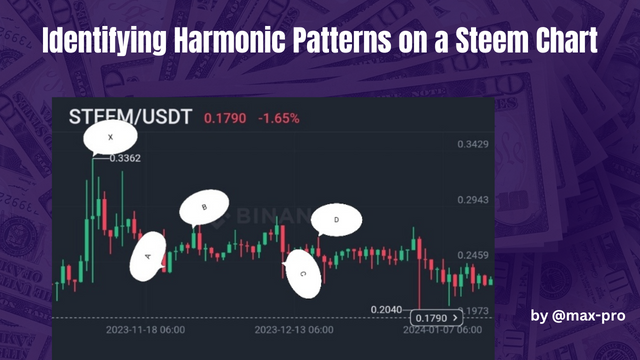
Detecting harmonic patterns in the historical price chart of STEEM/USDT is considered a complex process. Here various patterns are analyzed based on price movement. Here are some common harmonic patterns and the role of the Fibonacci ratio.
 made by Canva
- Harmonic pattern
Gartley Patterns Gartley patterns are usually both bullish and bearish. When this pattern is visible on the chart it is formed near support or resistance points which predicts a reversal price movement. Bat pattern means that the bat pattern usually indicates the movement and volatility of the currency price. A crab pattern is defined as a very short crab pattern. Where the price rises sharply and reaches the 161.8% return point.
As an introduction to Fibonacci Ratios, the use of Fibonacci Ratios in harmonic patterns helps identify price movement repeats and corrections. For example a Gartley pattern formed when the price reaches the 78.6% Fibonacci level will act as a trend reversal signal.
As a price movement forecast, it is understood that if the Gartley or Bat pattern is correctly formed based on the harmonic pattern and they are close to the Fibonacci level then the potential price will be like this. If the completion of the pattern gives a bullish signal then the price of STEEM/USDT will move higher indicating the possibility of a retracement of the previous high or a new high. On the other hand, if the end of the pattern gives a bearish signal, the price will move lower and try to break the previous support level.
So identifying the harmonic pattern in the chart of STEEM/USDT and correlating it with the Fibonacci ratio is an effective strategy that helps in making the right decision in trading. It can also give more effective results if properly coordinated with market conditions and other technical indicators as well.
| Question 3: Applying Fibonacci to Harmonic Patterns. (Demonstrate how Fibonacci retracement and extension levels are used in harmonic pattern analysis. Provide an example of how a harmonic pattern predicted a significant price reversal in the Steem market.) |
|---|
Basically Fibonacci retracement and extension levels play an important role in harmonic pattern analysis. So these patterns basically indicate market dynamics and possible price reversals. Below are the uses of Fibonacci retracement and extension levels.
Fibonacci Retracement: Basically when a price rises or falls, it usually pauses at some point. Fibonacci retracement levels such as 23.6%, 38.2%, 50%, 61.8%, 78.6% are used to determine these breakout levels. If the price returns to the 61.8% level after a trending uptrend, the possibility of a reversal increases.
Fibonacci Extension: Basically it is used to determine future price targets. The 161.8%, 261.8% and 423.6% levels are commonly targeted. If the price is following a certain pattern and wants to reach the next level then that target can be determined using Fibonacci extension levels.
Examples of Harmonic Patterns such as Garlic Pattern: A garlic pattern can be seen in the STEEM market. In this pattern we can see that the initial impulse rises from A to B followed by a pullback from B to C. It then returns from C to D where the D point is usually located at the 78.6% Fibonacci retracement level.
 made by Canva
However, if the price retraces to the 61.8% or 78.6% level at points C to D, it may signal a significant price reversal. If the price starts to rise again after the D point then it will be a good buy signal. So we can say that Fibonacci retracement and extension levels are very effective tools in harmonic pattern analysis. By correctly identifying these levels and making decisions based on market dynamics, traders manage their investments more accurately and predict the likelihood of reversals.
| Question 4: Trading Strategies with Harmonic Patterns. (Develop a step-by-step trading strategy for the Steem token using harmonic patterns. Outline your entry and exit points based on the completion of a harmonic pattern and explain how you would manage risk throughout the trade.) |
|---|
Following steps can be followed to create a trading strategy for Steem Token based on Harmonic Patterns. To identify Harmonic Patterns first identify the correct Harmonic Patterns. Commonly used patterns include Girlfish Pattern, Bat Pattern , Beach Pattern, Elliott Wave Pattern. So these patterns should be identified on the STEEM Token chart. So now the entry and exit points are set.
The entry point for the Girdley pattern would be the closing phase of the pattern at point D where the price usually goes down. Because this pattern has five points which are X, A, B, C, D. So the trick is to execute on point D of the pattern as a buy order. Its target is Fibonacci Extension at 61.8% or 78.6% level. On the other hand take exit point D as its departure point. Usually point D is the best place to exit.
Three things can be considered as risk management. Stop Loss: Set a stop loss 1%–2% below the entry point. This will limit your losses. Lot Size: Do not risk more than 1%-2% of your portfolio. For example if you have 1000 dollars in your trading account then you should risk 10-20 dollars in a single trade. Target Profit: Typically aim for a 1:2 or 1:3 risk-reward ratio. If your stop loss is $10 then your profit target should be $20-30. So after completing the trade you have to monitor the market changes and if there is any reversal with the pattern then you have to take action as per the advance plan.
| Question 5: Current Market Analysis Using Harmonic Patterns. (Analyze the current market conditions for Steem and apply harmonic patterns to forecast potential future price movements. Explain how these patterns could influence your trading decisions and the accuracy of your predictions.) |
|---|
The important point is that harmonic patterns are a powerful tool used in trading. It basically helps in making predictions based on particular patterns of market price movements. These patterns are used in various trading strategies and can be profitable for a trader if properly applied. Below are some basic steps that can be followed to analyze the STEEM market.
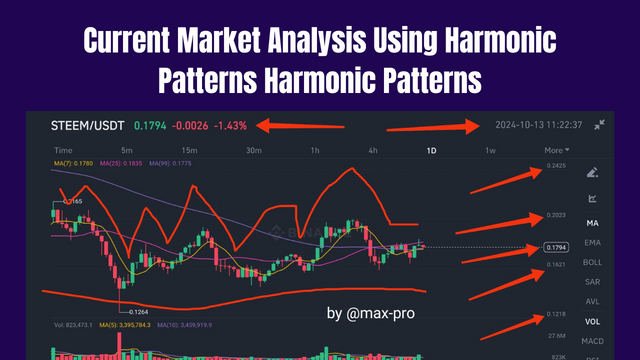
Current Market Status of STEEM :- STEEM is a digital gaming platform used to purchase games and other digital content. Its price fluctuates depending on its market value and number of users. Currently the STEEM market is experiencing price fluctuations and increasing user interest which indicates its market stability.
Understanding the application of harmonic patterns requires knowledge of harmonic patterns. These are Gartley Pattern, Bat Pattern and Elliott Wave Theory. So each pattern has its own specific structure and measurements that indicate the relationship between the initial price movement and the parallel line. These patterns create a specific rating profile and help predict future price movements.
 made by Canva
Harmonic patterns are basically based on Fibonacci ratios. If we identify a Gartley pattern it indicates to sell when the price reaches a certain level and to buy when it enters a new level. Again it also indicates that helps to identify entry and exit points at particular moments in the market. Harmonic patterns play an important role in trading decision making. But risk management means that identifying the right patterns helps the trader reduce risk. If a pattern is confirmed, the trader can limit his profit and loss.
In conclusion, it can be said that using harmonic patterns can be a useful technique for analyzing the current market of STEEM. It facilitates traders in understanding market movements and decision making process. Properly analyzing and applying the pattern is possible to be able to determine possible future price trends of rising and falling prices. Hence harmonic patterns will be particularly helpful in improving market analysis and trading strategy. So I simply shared my opinion here as per my idea. Hope everyone understood.

So I am Inviting my lovely Steemian friends @patjewell, @solaymann, @sushanta83 to Participate in this Competition.
https://x.com/Maxpro51412/status/1845336861012787693?s=19
Upvoted. Thank You for sending some of your rewards to @null. It will make Steem stronger.
@max-pro You did a great job explaining the harmonic patterns like Gartley Bat Crab and Butterfly. I like how you showed the Fibonacci levels and how they help find turning points in the STEEM/USDT chart. Your examples make it easy to understand how to use these patterns in trading. I also like how you talked about managing risk which is very important in trading. Good luck with the contest and I hope you do well!
Thank you so much for spending your precious time on this post and giving such a wonderful comment.
My dear friend, thank you very much for your interest in participating in the contest. I looked at the topics and observed that you have written well but the screenshot is a little exception like the Fibonacci retestment level that you did not share. Anyway, thank you very much and best of luck for participating in the contest.
This post has been upvoted/supported by Team 5 via @philhughes. Our team supports content that adds to the community.