S20W5: Trading Steem with Harmonic Patterns
.png)
My Dear Friend is back on the crypto Academy Engagement Challenge in the fifth week of Season 20. This time the topic is given about the harmonic indicator. It is very complex and its accuracy is very sure. Friends, I am sharing the contest link here. Without further ado, let's start writing about the contents of the contest.
Fundamental harmonic patterns are certain structures found in the markets commonly applied by traders in the estimation of market direction. The patterns, also known as Fibonacci patterns, involve Gartley pattern, Bat pattern, Butterfly pattern and Crab pattern. Every pattern has some unique features derived from unique areas of price retracement and extension. For example, the bearish Gartley pattern is usually formed at 61.8% retracement level and an extension at 78.6%. These formations help the traders to find out the new reversal points in the market and add on to value its decision making.
Harmonics are considered as one of the most complicated technical indicators used within trading with the purpose of defining potential reversal point (PRZ) calculated according to Fibonacci rates. The Gartley pattern, Bat pattern, Crab pattern, and the Butterfly pattern are four of the most significant harmonic patterns and all possess their own unique structures as well as having their predetermined Fibonacci levels that the trader uses to try and predict the movements of price in the market.
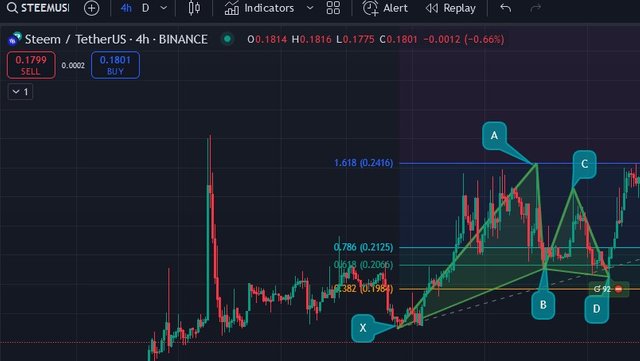
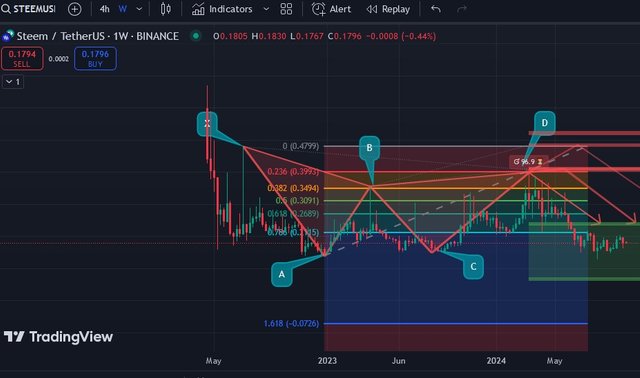
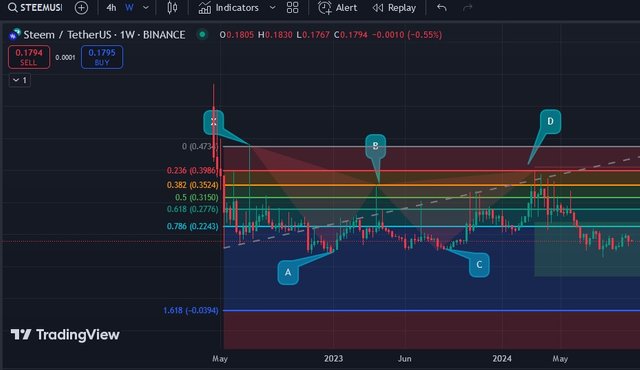
Gartley Pattern: This formation involves a correction of 61.8% of the first segment (XA) and a correction of 78.6% of the second segment (AB). The completion point (D) usually corresponds to the 78.6 percent of the XA leg. When entering the Steem/USDT pair, it is possible to define a Gartley pattern to come across a bullish reversal when nearing point D.
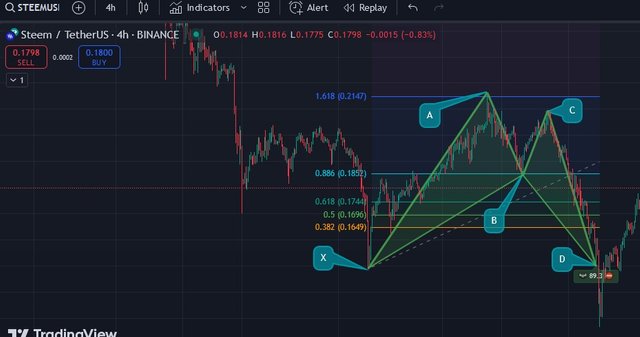
Bat Pattern: The Bat pattern exhibits a clearer structure where point B returns to fifty percent of XA and point D, is the 88.6 percent retracement level. Such pattern seems to indicate that there is extremely bullish reversal bar after point D for Steem/USDT.
Crab Pattern: The Crab pattern is characterized by deep retracement; point B should ideally be 61.8% XA, while point D, hits the extreme at 161.8/% XA or 224/% from AB. Because traders seek trends that signal large reversals in Steem/USDT, this pattern is most useful when the chart reaches this level.
Butterfly Pattern: This pattern involves a first wave (XA), counter trend second wave (B) that retrace to 78.6% of the distance from A to X, and the final third wave that is more than twice as long as the first, at point D near or beyond the 161.8% level of XA or a 127% extension from AB. This Butterfly pattern can mean bearish reversal signs when the price of Steem/USDT gets to point D.
Through studying these harmonic patterns together with related Fibonacci levels, the sellers can accurately identify some price within the Steem/USDT pair and improve the decision-making process of enter-or-exit moments.
In Steem charting, harmonic patterns are the pattern analysis on the price movement in that those patterns are used to determine the reversal or continuation of the market trend. These patterns, for instance the Gartley, Bat and Butterfly patterns are coined by specific Fibonacci retracement levels marriage. Such formation is useful to the traders since they are depending with it in forecasting the future price movement based on the past movements. The identification process is quite oriented on market psychology and several principles of technical analysis permitting to make correct decisions after the observation of patterns on the Steem chart.
In a bullish Gartley pattern this indicator will move from point X to A (The initial leg) then pull back to point B which is usually 6.38% the XA Then move up to point C which 78.6% the AB. At last, the price goes to point D with the best hits at the 88.6% retracement of XA. On the other hand the bearish Gartley pattern retraces the structure described above in an opposite manner.
Another point is to pay peculiar attention to the ratios because without the compliance with Fibonacci ratios, the pattern is unreliable. These ratios are also used by traders to estimate likely price fluctuations after the completion of the indicated pattern at point D. Knowing when to trade can be influenced by the price touching point D and a potential of reversal that can be in form of candle stick pattern or volume. The expectation then is that should the price reach point D then it can either reverse back up as has been observed in the bullish market and begin to drop like a bear in the bearish market.
Taken as a whole, knowledge of how the Gartley pattern works in conjunction with Fibonacci ratios and to make appropriate decisions regarding, for example, points of entry and exit using past price action.
The levels of retracement and the extension are compulsory instruments of harmonic pattern analysis- a working strategy, which is applied by traders to determine probable reversal points in the market. In particular, we can mention Harmonic Gartley, Harmonic Bat, and Harmonic Butterflies, in which Fibonacci ratios are even used to define the pattern. These patterns simply involve price patterns that form some geometrical figures to be identified on chart; and the entire ‘legs’ within such patterns relate directly to the Fibonacci retracement or extension.
Harmonic patterns of Fibonacci retracement levels are percentage levels which are utilized to define the areas of reversal after a sharp price move. For example, looking at an asset and it starts to have a bullish run or goes up and has correction lower, traders will try to find out where the price levels of correction are such that it could reverse back into the trend.
It is equally possible to provide an example of how harmonic patterns indicate a massive reversal in price: in the Steem market, during a powerful rise and a subsequent pullback. Merchants observed that a Bat pattern emerged when the price of Steem fitted the top level and was in the process of going down. The first leg (XA) skyrocketed, followed by a retreat to almost the 61.8 % Fib level of XA (B) before another advance (C). It also went beyond the peak at CD at about 88.6% AB level on average.
The fact that Fibonacci levels were aligned with the structure of the Bat pattern meant that the signal at that point in time was a sell signal suggesting reversal and many traders adopted the long side thinking that after this adjustment, the price would be headed up.
Identify the Gartley Pattern: The first step is to identify some sort of Gartley pattern on the chart of the Steem token’s price. There are five points in this pattern; X, A, B, C, and D and it is established after a large price changes. The key ratios to look for are:
AB should be 61.8% retracement of XA and the high of the candle at the right point should be the pullback point. BC should be the 38.2% or 88.6 % the AB retracement level. CD should be 78.6% retracement of XA but it failed to hold this level and has pulled back slightly lower to the level indicated.
Entry Point: After the formation of the Gartley pattern is complete with point D, the traders should place a buy order above the high of point D so as to enter the trade when the price starts to turn around.
Setting Stop-Loss: To control the risks involved, the stop loss order should be set a bit below point x or below point D depending with volatility. This helps prevent severe loss in case the market turns against your position on the market.
Take Profit Levels: Place several take-profit points by use of the Fibonacci extension tool:
First target at 61.8% extension from point X. Second target to reach 100 percent extension from point X. End point at 161.8% extension from point X.
Risk Management: Also during the trade, always check the market trends and add trailing stop-losses to secure profits as the stock moves right towards the targets. It is recommended that whenever your first take profit level is triggered; engage the trailing stops so as to maximize profits while minimizing the risks. In this way, using harmonic patterns such as Gartley, traders work effectively with Steem tokens and manage the risk at each stage of the trade.
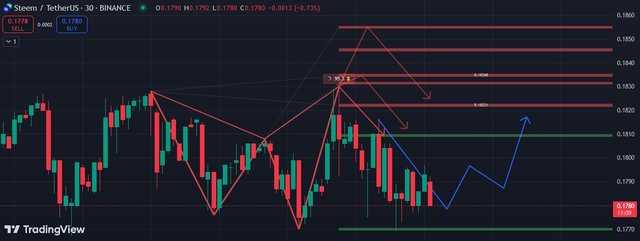
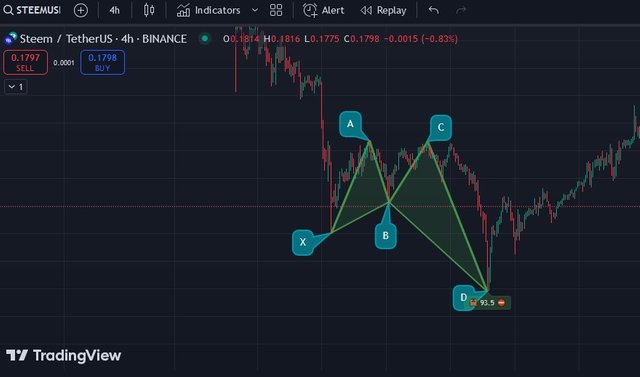
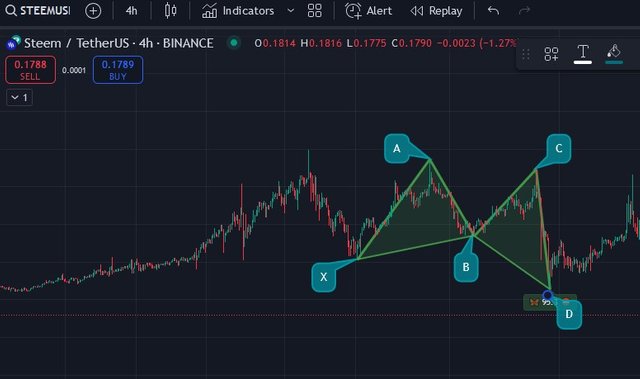
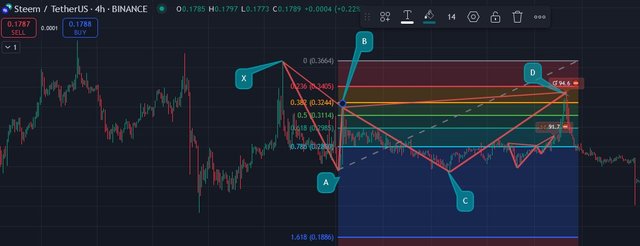
I have analyzed and given you a screenshot of what we see when analyzing the harmonic pattern at present, but I want to say something here, currently it is showing a Girdly pattern, but exceptionally we can say that in the future we can see a harmonic butterfly pattern. Since we know that the market is in pairs and the price level is down, there can be an influx of buyers and the market can form a new pattern. Through which we can see a harmonic pattern and the price will go upwards.
As you can see I have taken a time frame of 30 minutes and have set up the Harmonic Indicator there automatically showing this scenario from the trading view as you can see in the screenshot. However, it is certain that the market is currently down and a new harmonic pattern will be formed in the market and the price level will move upwards.
Therefore, the use of harmonic patterns for trading Steem will be useful to strengthen a trader’s chances of seeing a particular market reversal or continuation. With the help of these structures, it is possible to predict the rates movements and adjust our entries and exits key points. Trading strategies for assets that incorporate harmonic patterns make trading less of an emotional exercise and more of a systematic process that make trades more successful. Like with any other type of trading approach, harmonic patterns must always be used in conjunction with proper risk management techniques to ensure that the huge fluctuation in cryptocurrency prices is well managed.

Thanks to everyone here is an invitation @abdul-rakib @simonnwigwe & @josepha
X promotion link
https://x.com/mostofajaman55/status/1844937446238376054
Upvoted. Thank You for sending some of your rewards to @null. It will make Steem stronger.
Thank you so much for support @malikusman1
@mostofajaman I appreciate how you have broken down the key patterns like Gartley Bat Crab and Butterfly and their use in predicting price reversals in the Steem/USDT pair. The step by step trading strategy based on these patterns is very useful especially the tips on managing risk with stop loss and take-profit points. It's clear that harmonic patterns can be powerful tools when used properly. Best of luck with the contest and keep up the great work!
Hey thank you so much.
Dear @mostofajaman
Everyone can learn a lot from this post about the function of harmonic patterns. Your assessment on STEEM market is very instructive, thanks for sharing such a wonderful post.
Good luck for the contest.
thank you so much for your valuable comment. 🙋♂️